Nasdaq Selloff 2026: AI Stocks, Semiconductor Risk, and the Hidden Danger of 3× Leveraged ETFs
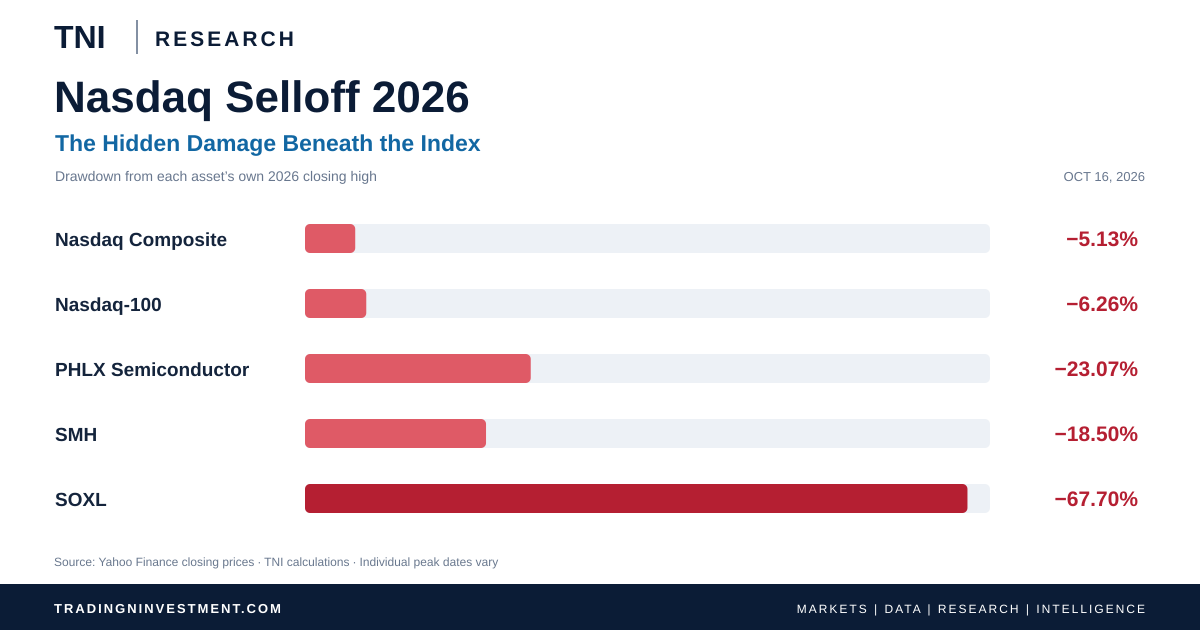
The Nasdaq is retreating, semiconductor losses are deeper, and SOXL illustrates how daily leverage can magnify investor risk.
The Semiconductor Selloff Beneath the Nasdaq
Seven AI, memory, storage and semiconductor stocks — drawdown from each stock's own 2026 closing high.
As of October 16, 2026. Source: Yahoo Finance closing prices; TNI calculations. Peak dates vary by stock.
What happened to the Nasdaq?
On October 16, 2026, the Nasdaq Composite declined 1.98%. Its closing level stood 5.13% below its 2026 closing high.
The weakness extended beyond the broad index. Semiconductor exposure experienced considerably larger declines, particularly in leveraged products.
September 1–October 16, 2026. Daily closing-price drawdowns; reference high is calculated from the full available Nasdaq series.
Semiconductors and SOXL: where losses accelerated
Between the October 13 and October 16 closes, SOXL declined 23.84%. Over the same dates, SMH fell 7.30%, while the PHLX Semiconductor Index declined 7.78%.
These are different instruments with different index methodologies. SMH and the PHLX Semiconductor Index provide semiconductor context, not an exact reconstruction of SOXL's benchmark returns.
SOXL's 67.70% drawdown: understanding leveraged ETF risk
SOXL seeks three times the daily performance of its designated semiconductor benchmark, before fees and expenses. Its objective resets daily; it does not promise three times the benchmark's cumulative return over longer periods.
A hypothetical benchmark loss of 5% in one day would correspond to approximately 15% for a perfectly tracking 3× long fund, before costs. Actual fund returns can differ.
Compounding also matters. If a benchmark falls 10% and then rebounds 11.11%, it returns approximately to its starting level. A hypothetical daily-reset 3× product would fall 30%, then gain 33.33%, ending about 6.67% lower.
This illustrates path dependence, not a forecast or an attribution of SOXL's observed losses.
Explore the TNI Leveraged ETF ScannerHow does the selloff compare with previous Nasdaq declines?
The dot-com collapse, the global financial crisis, the COVID shock, and the 2022 bear market offer useful historical context. Their causes and recovery paths differed.
Historical comparison is provisional. Drawdowns use the running all-time closing high; the 2008–2009 episode therefore retains the earlier dot-com peak as its reference. The 2026 historical value is the worst year-to-date drawdown, not the October decline.
The Nasdaq's worst 2026 year-to-date drawdown in this dataset occurred on March 30. It should not be confused with the smaller October drawdown.
What could happen next?
A sustained recovery would require stabilization in semiconductor leadership, improving market breadth, and a reduction in downside volatility.
Continued weakness could deepen drawdowns, especially for investors holding leveraged semiconductor exposure. Neither scenario is a prediction.
Data and methodology
Source: Yahoo Finance historical daily closing prices, downloaded October 16, 2026. TNI calculated daily returns, cumulative price changes, and closing-price drawdowns.
Figures exclude dividends and other total-return adjustments. SOXL historical prices may reflect share splits; the analysis uses the downloaded Close series. Results are historical and not investment advice.
Additional research: Nasdaq Research · Leveraged ETF Research