Are AMD and Nvidia a Buy, or Could Both Fall Again? TNI’s 15-Day Stock Forecast
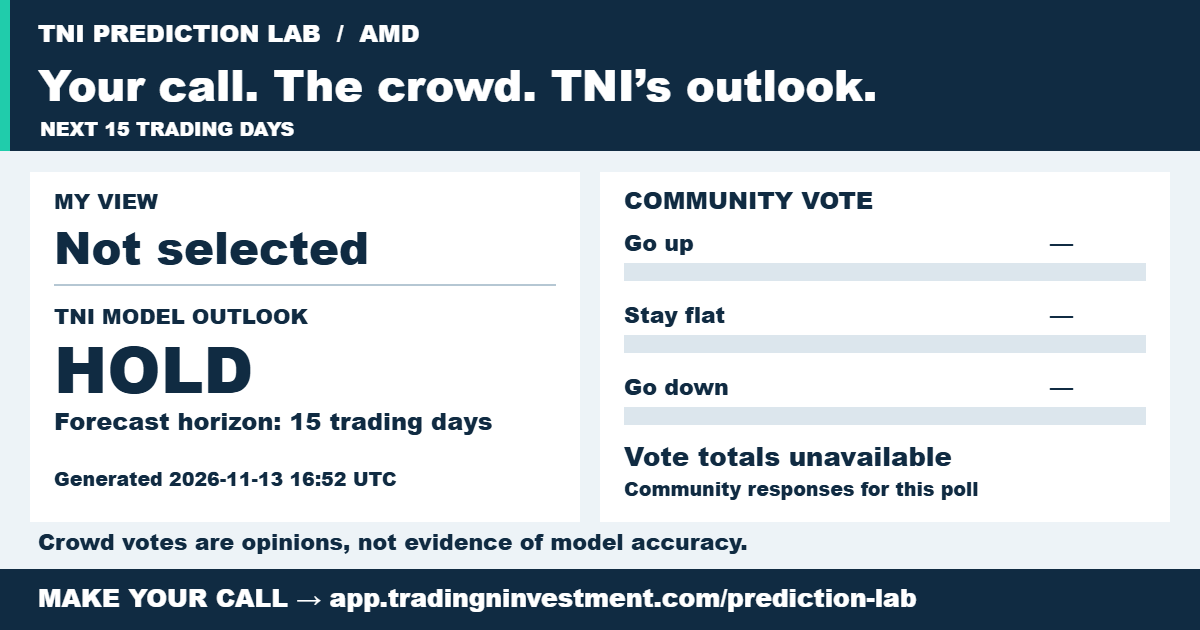
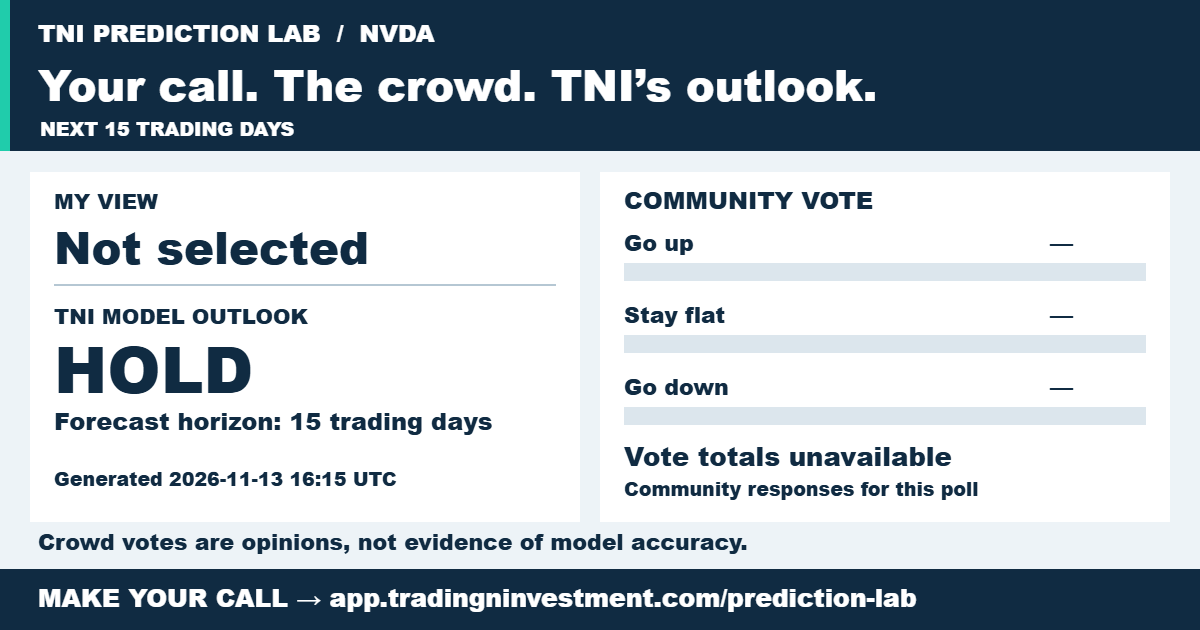
AMD rose 5.86% while Nvidia fell 4.34% on November 12. After a session like that, which stock looks like a buy for the next 15 trading days? TNI’s November 13 forecast gave both a HOLD. Nvidia had the stronger quantitative signal: its Quant Agent flagged BUY even as the stock traded below its 20-, 50-, and 200-day moving averages. AMD held above two of those three averages, yet its Quant Agent saw less upside. The final calls leave open whether the two stocks will fall together again.
A Nasdaq rebound inside a larger decline
The direction of the market depends on where you start the chart. The Nasdaq Composite closed at 25,366.09 on November 12, down about 0.4% that day. It had nevertheless gained 3.2% for the week through Thursday. Zoom out to October 6, when the index closed at a record 27,599.89, and the November 12 close was still 8.1% below the peak. A trader buying the weekly rebound and an investor measuring the damage since October were seeing different parts of the same move. November 12 market close · October Nasdaq peak
That distinction matters for the two chipmakers. On November 12, AMD rose 5.86% to $585.30 while Nvidia fell 4.34% to $166.19. The spread between their daily returns was 10.2 percentage points on a day when the benchmark barely moved by comparison. A Nasdaq forecast alone would have missed the most important feature of that session: investors were treating the two companies differently. Those closing prices also establish a common starting point for comparing Wall Street’s targets below.
Two chip stocks, two different price trends
AMD’s Risk Agent used a November 13 reference price of $523.13. That put the stock above its 20-day average of $518.76 and its 200-day average of $421.71. The gap was in the middle: AMD traded $29.86 below its 50-day average of $552.99. A sustained recovery above that average is the development the Risk Agent flagged for readers to watch.
Nvidia’s reference price of $160.13 sat below all three averages: $201.25 over 20 days, $215.94 over 50 days and $204.07 over 200 days. Nvidia was roughly 25.8% below its 50-day average, compared with 5.4% for AMD. That is the striking feature of this forecast: the stronger quantitative signal belonged to the stock with the deeper shortfall against its recent price history.
Both sets of moving averages use data through November 12. The Lab treats trend information as advisory. It does not change the model probability, risk classification or final decision.
What each agent reported
| November 13 snapshot | AMD | Nvidia |
|---|---|---|
| Quant Agent | HOLD · 36.5% model probability | BUY · 72.1% model probability |
| Rolling diagnostic | 20.0% | 60.0% |
| News Agent | Neutral · 45.0% confidence | Neutral · 48.8% confidence |
| News coverage | 3 articles · 3 material events | 4 articles · 4 material events |
| Risk Agent trend | Above SMA20 and SMA200; below SMA50 | Below SMA20, SMA50 and SMA200 |
| Decision Agent | HOLD · 15 trading sessions | HOLD · 15 trading sessions |
The four-agent workflow brings quantitative signals, news and risk evidence to the Decision Agent. In this snapshot, the News Agent rated coverage neutral for both companies. Nvidia’s Risk Agent classified risk as moderate, identified a high-volatility profile and showed a clear event-risk flag. Its trend-adjusted ranking score was 20.06, a separate measure from the 72.1% model probability. The published evidence does not specify which input determined the final HOLD.
Jensen Huang’s exit changes what Nvidia investors must evaluate
On November 12, Nvidia announced that Jensen Huang had resigned as chief executive, president and a board member. Chief Financial Officer Colette Kress became interim CEO while retaining her finance responsibilities. The board began a search that includes internal and external candidates. That leaves investors assessing two questions at once: whether customers will stick to their deployment plans and how much visibility they have into leadership beyond the interim appointment. Nvidia’s announcement
The timing matters when interpreting the News Agent. Its November 13 sample included a story about Nvidia’s valuation after Huang’s departure, yet its aggregate reading across four articles was neutral, with 48.8% confidence. That describes the articles the agent reviewed. It cannot tell us how a particular customer will respond or whether an analyst has already revised a target. Those questions require subsequent disclosures from customers, Nvidia and the analysts themselves.
Wall Street’s 12-month targets favor Nvidia on implied upside
At the November 12 close, S&P Global’s survey of 54 AMD analysts showed an average target of $657.74 and a median of $650. Against AMD’s $585.30 close, the average implied 12.4% upside. Estimates ranged from $525 to $1,250. The low estimate implied a loss from that close even though the consensus rating was Strong Buy. In a separate assessment dated November 4, Zacks assigned AMD Rank #3 (Hold) after earnings. AMD analyst forecast · Zacks post-earnings assessment
For Nvidia, 61 analysts had an average target of $285.35 and a median of $282. Relative to the $166.19 close, the average implied 71.7% upside. Individual targets stretched from $174 to $515. The wide gap between price and consensus is especially difficult to interpret the day a founder departs: an analyst survey can contain targets issued under different leadership assumptions. The November 12 snapshot does not establish how many analysts had revised their estimates after the announcement. Nvidia analyst forecast
Two Nvidia figures look remarkably similar here. The 71.7% is the arithmetic distance from the closing price to the average one-year target. The 72.1% is the Quant Agent’s model probability for its directional signal. Neither number says Nvidia is expected to gain 72% over the next 15 sessions. Both can coexist with a near-term HOLD, and only the analyst target supplies a dollar figure.
Where AMD earnings fit into the forecast
AMD reported $13.4 billion in third-quarter revenue and guided to roughly $17 billion in the fourth quarter. Adjusted gross margin guidance was about 55%, compared with 56% in Q3. The earnings question is whether AMD can deliver that increase in sales while sustaining its margins. The Lab’s November 13 call answers a shorter-horizon question about the stock. Neither company’s HOLD supplies a dollar price target. AMD’s Q3 earnings release
When to check the forecast again
Nvidia’s recorded decisions on October 28, October 30, November 2 and November 13 were all HOLD. Those calls establish continuity, but the Lab leaves HOLD unscored, so the four observations cannot establish a win rate. When a new decision appears, compare its timestamp, horizon and supporting evidence with this snapshot. For Nvidia, the first question is whether the Quant Agent’s BUY persists and whether the final decision changes with it.
Make your own market call in the free Mini Lab, or explore SPY, QQQ and IWM in the free Prediction Lab. Individual-stock agent evidence requires sign-in: AMD · NVDA.
Download the original AMD forecast card (PNG)Download the original NVDA forecast card (PNG)Disclaimer. This forecast is for educational purposes only and does not constitute financial advice.