Anthropic IPO: Who Gets the First-Day Gains?
A descriptive study of 15 large US listings: offer prices, opening premiums, first-day gains and losses, and Anthropic’s reported financial risks.
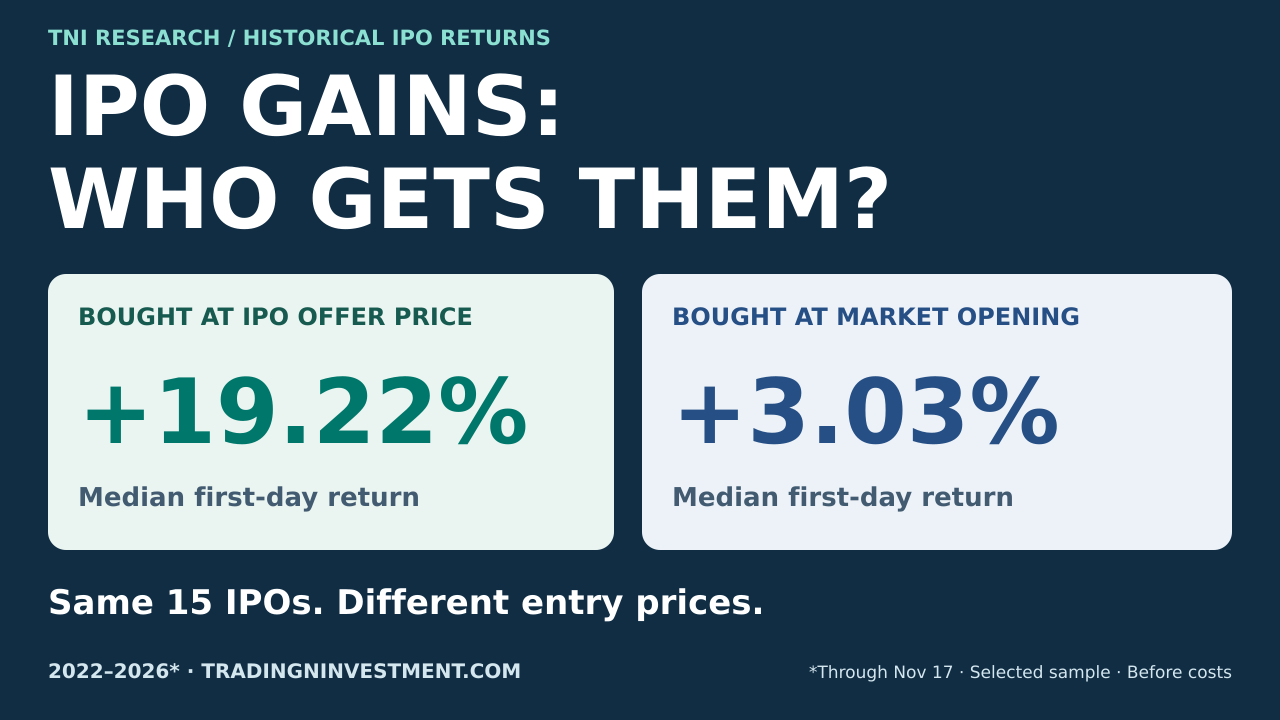
Three of the 11 IPOs in this study that closed above their offer price still lost money from the opening trade. The median offer-to-close return was 19.22%; the median opening-to-close return was 3.03%. The price used to measure a debut changes the story investors see.
This article examines the three largest eligible traditional US IPOs in each calendar year from 2022 through November 17, 2026. Anthropic’s proposed listing provides current context. It has no observed debut return at the research cutoff and is excluded from every historical statistic below.
How the biggest IPOs performed on debut day, 2022–2026
Selection uses gross base proceeds before the underwriters’ additional-share option. We take three offerings per year rather than letting 2026 dominate the sample. SPACs, direct listings, closed-end funds and US cross-listings of companies already trading abroad are excluded. INNIO therefore enters the 2026 group; SK hynix’s US depositary-share listing does not.
Figure 1. Offer returns versus opening-buyer returns
Offer → close in teal · Opening trade → close in navy
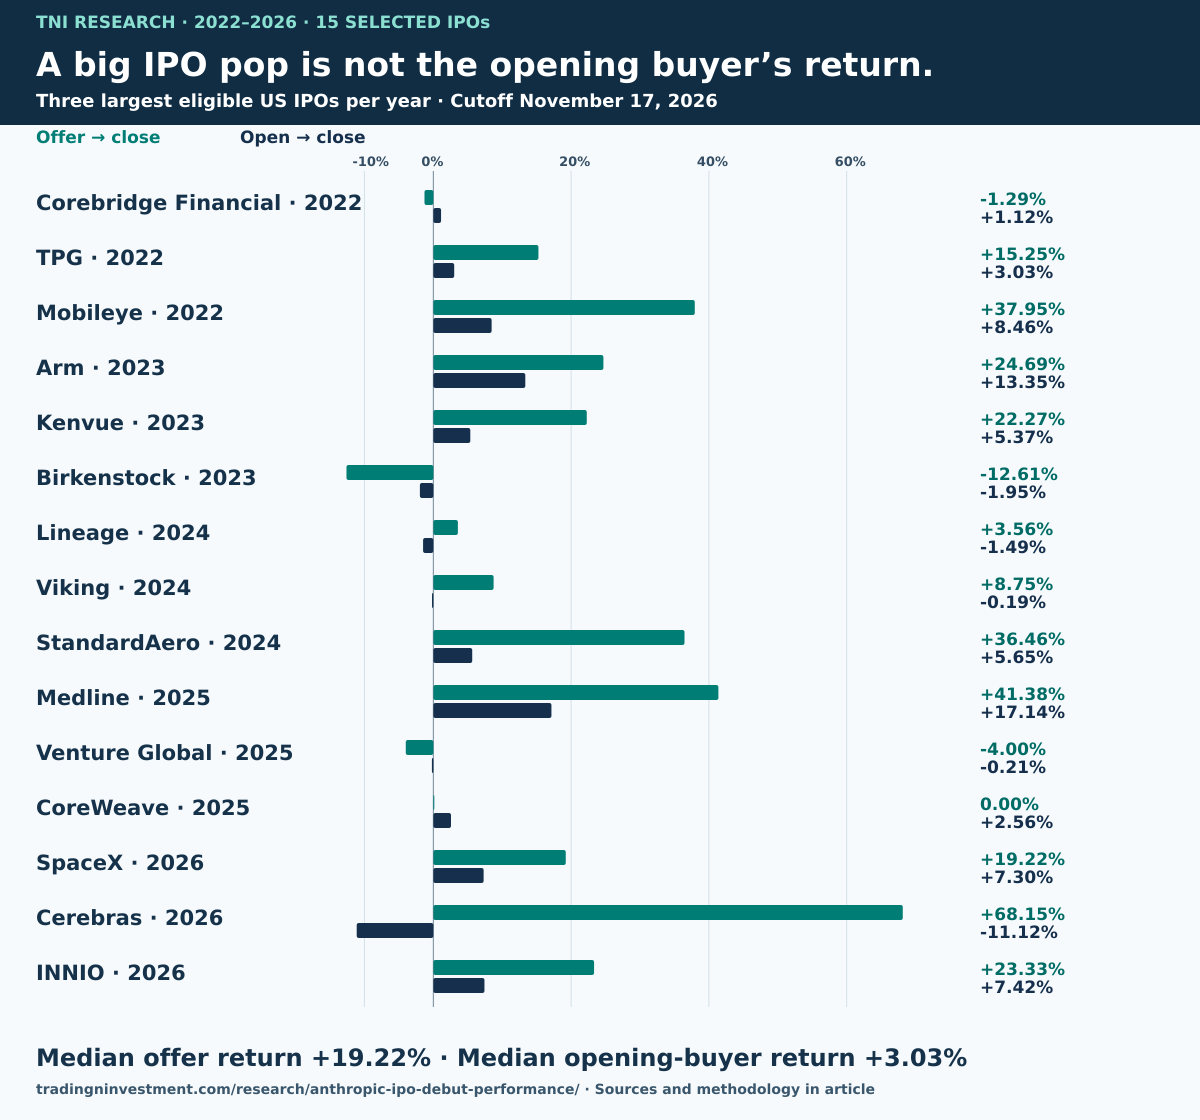
Year-by-year results show different outcomes
The 2024 group had three positive offer returns, but only one positive opening-to-close return. In 2025, the median offer return was zero. Each annual median uses only three companies, so a change in one issuer can move the result substantially.
Figure 2. How the purchase price changed first-day returns
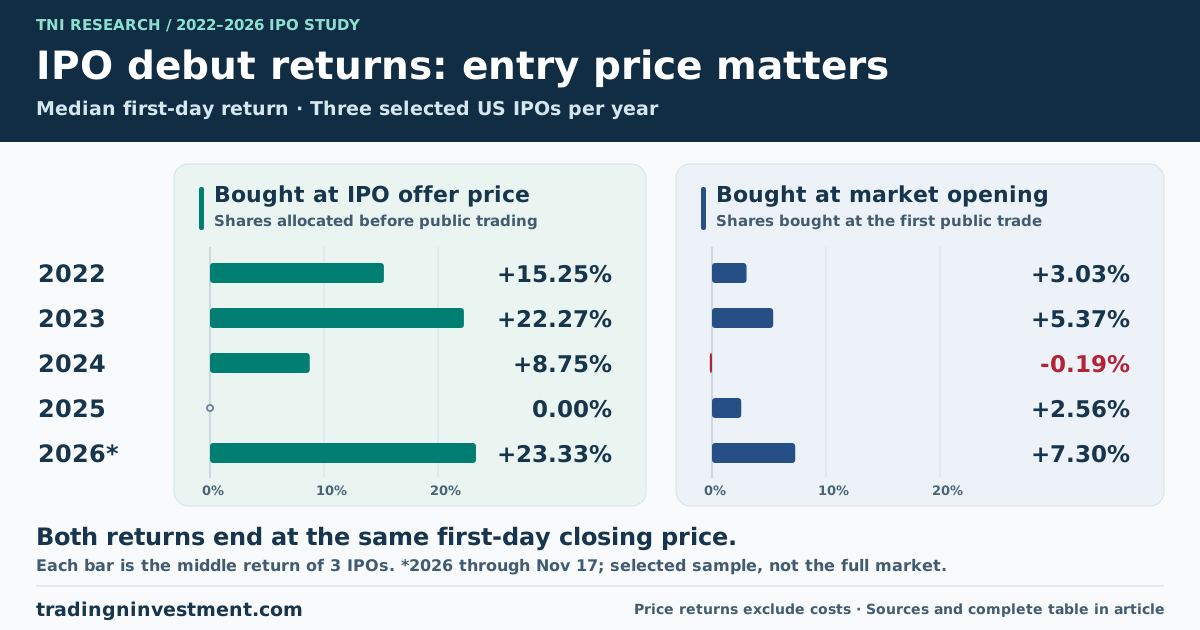
| Year | Bought at IPO offer price → close | Bought at first market trade → close | Above offer | Above open |
|---|---|---|---|---|
| 2022 | +15.25% | +3.03% | 2/3 | 3/3 |
| 2023 | +22.27% | +5.37% | 2/3 | 2/3 |
| 2024 | +8.75% | -0.19% | 3/3 | 1/3 |
| 2025 | 0.00% | +2.56% | 1/3 | 2/3 |
| 2026 through Nov 17 | +23.33% | +7.30% | 3/3 | 2/3 |
| Company / debut | Base $bn | Offer | Open | Close | Offer → close | Open → close |
|---|---|---|---|---|---|---|
| Corebridge Financial CRBG · 2022-09-15 | 1.680 | $21.00 | $20.50 | $20.73 | -1.29% | +1.12% |
| TPG TPG · 2022-01-13 | 1.000 | $29.50 | $33.00 | $34.00 | +15.25% | +3.03% |
| Mobileye MBLY · 2022-10-26 | 0.861 | $21.00 | $26.71 | $28.97 | +37.95% | +8.46% |
| Arm ARM · 2023-09-14 | 4.870 | $51.00 | $56.10 | $63.59 | +24.69% | +13.35% |
| Kenvue KVUE · 2023-05-04 | 3.802 | $22.00 | $25.53 | $26.90 | +22.27% | +5.37% |
| Birkenstock BIRK · 2023-10-11 | 1.484 | $46.00 | $41.00 | $40.20 | -12.61% | -1.95% |
| Lineage LINE · 2024-07-25 | 4.437 | $78.00 | $82.00 | $80.78 | +3.56% | -1.49% |
| Viking VIK · 2024-05-01 | 1.537 | $24.00 | $26.15 | $26.10 | +8.75% | -0.19% |
| StandardAero SARO · 2024-10-02 | 1.440 | $24.00 | $31.00 | $32.75 | +36.46% | +5.65% |
| Medline MDLN · 2025-12-17 | 6.265 | $29.00 | $35.00 | $41.00 | +41.38% | +17.14% |
| Venture Global VG · 2025-01-24 | 1.750 | $25.00 | $24.05 | $24.00 | -4.00% | -0.21% |
| CoreWeave CRWV · 2025-03-28 | 1.500 | $40.00 | $39.00 | $40.00 | 0.00% | +2.56% |
| SpaceX SPCX · 2026-06-12 | 75.000 | $135.00 | $150.00 | $160.95 | +19.22% | +7.30% |
| Cerebras CBRS · 2026-05-14 | 5.550 | $185.00 | $350.00 | $311.07 | +68.15% | -11.12% |
| INNIO INIO · 2026-06-04 | 2.430 | $27.00 | $31.00 | $33.30 | +23.33% | +7.42% |
Three offerings finished below their offer price, while CoreWeave finished unchanged. Five closed below their opening trade. These outcomes describe this selected group, rather than the entire IPO market or a probability forecast for Anthropic. Median returns also conceal substantial differences between individual deals.
Download prices, returns and source links as CSV ↓Which IPO gains survived the opening premium?
Eight IPOs gained from both entry points. Three—Lineage, Viking and Cerebras—closed above the offer but below the opening trade. Birkenstock and Venture Global lost from both. Corebridge gained only from the open, while CoreWeave matched its offer and gained from the open.
Figure 3. Five different debut outcomes
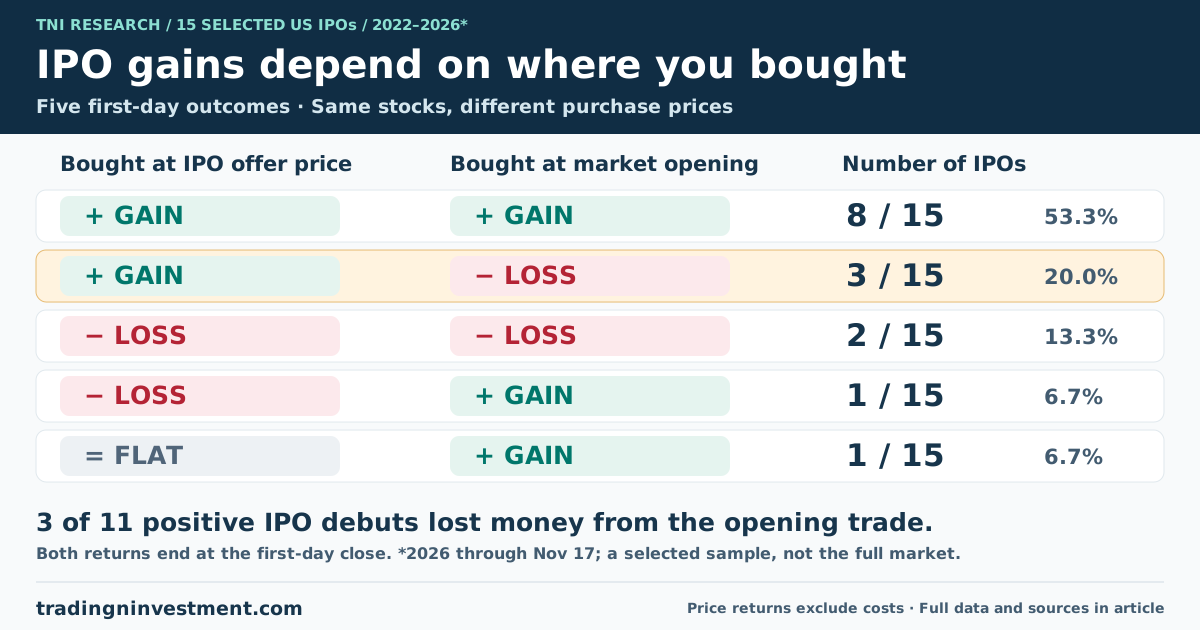
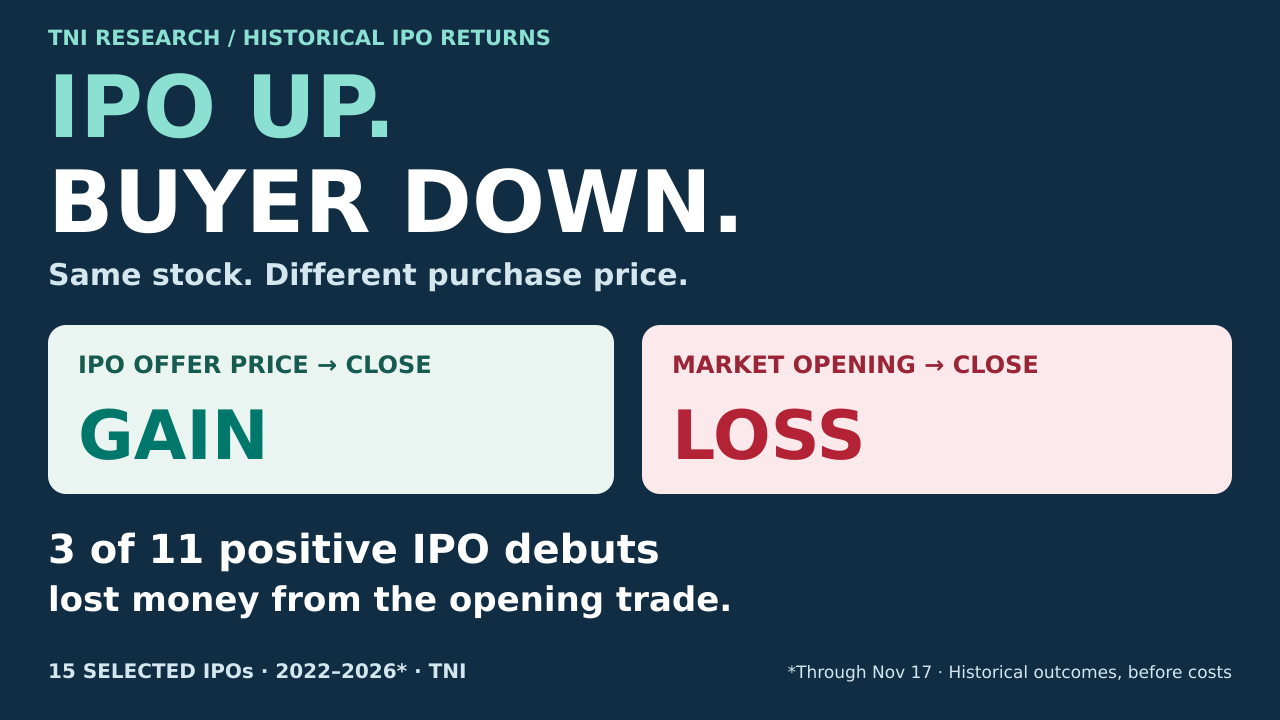
Cerebras priced at $185, opened at $350 and closed at $311.07. That produced a 68.15% offer-to-close gain, but an 11.12% opening-to-close loss. An investor could correctly anticipate intense demand yet lose money during the debut by paying the opening premium. The headline gain belonged to a different starting price.
SpaceX offered shares at $135, opened at $150 and closed at $160.95. Both entry points gained, but by different amounts: 19.22% from the offer and 7.30% from the opening trade. Its record deal size did not eliminate the importance of execution. Debut closing report.
Arm’s $51 offer became a $56.10 opening trade and a $63.59 close in September 2023. The corresponding returns were 24.69% and 13.35%. Medline also rewarded both groups in December 2025, closing at $41 after a $29 offer and $35 opening trade. Neither example establishes a repeatable result for a future listing.
Lineage and Viking illustrate a subtler outcome. Each finished above its offer price but below its opening trade. CoreWeave reversed the pattern: its $40 close matched the offer but exceeded the $39 open. Reporting only the offer-based return misses the experience of investors trading after the listing begins.
Anthropic’s proposed offer and financial position
Anthropic’s IPO website expects pricing on November 18 and public trading on November 19, subject to regulatory clearance. The proposed Nasdaq ticker is ANT. These are expected milestones. At this article’s November 17 cutoff, there is no final offer price, opening trade or debut-day closing return.
| Indicative price range | $70–$78 per Class A share |
|---|---|
| Base public offering | 825 million shares |
| Calculated gross offer size | $57.75 billion–$64.35 billion |
| Offered by Anthropic | 801,351,354 shares |
| Offered by selling holders | 23,648,646 shares |
| Underwriters’ option | Up to 123.75 million additional shares |
| Separate private placement | $26.0 billion; excluded from public IPO size |
The public offer size is 825 million multiplied by the indicated price. It includes shares sold by existing holders, so it is not the cash Anthropic would retain. Underwriting costs, the additional-share option and the concurrent private placement must be treated separately. Preliminary prospectus · Company timetable.
At the top of the range, the base public sale would remain below SpaceX’s $75 billion base IPO in June. Offer size measures the transaction, not the company’s profitability or the return available after listing.
Revenue growth alongside operating and accounting losses
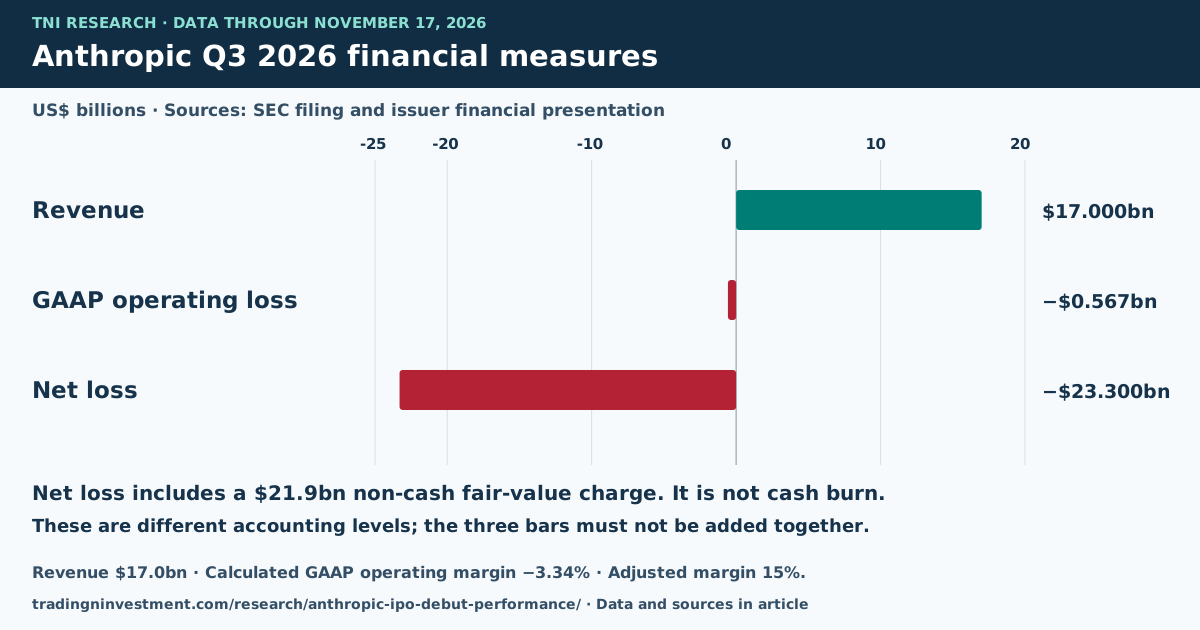
Anthropic reported $17.0 billion of revenue in Q3 2026, a $567 million GAAP operating loss and a $23.3 billion net loss. Its presentation reports a 15% adjusted operating margin. These are different accounting measures; adjusted profitability does not establish GAAP profitability. November 17 filing.
Figure 4. Anthropic’s Q3 2026 financial measures
| Measure | Reported figure | Interpretation |
|---|---|---|
| Q3 GAAP operating margin | −3.34%, calculated | −$0.567bn ÷ $17.0bn; rounded revenue input |
| Q3 adjusted operating margin | 15%, company-reported | Uses exclusions; inspect the reconciliation |
| Q3 non-cash fair-value charge | $21.9 billion | Included in, rather than additional to, net loss |
| Compute / infrastructure commitments | $895.4 billion | Committed future spending; not current debt or cash already spent |
| Commitments in the next 12 months | $70 billion | A timing measure within the broader commitment total |
| Founder Class F voting power | 50.1% | Public-share ownership does not confer equivalent control |
The operating margin above uses rounded reported figures. The fair-value charge explains much of the net loss but does not erase operating costs. The commitments reported by AP from the filing extend over time and require funding; treating all $895.4 billion as debt due immediately would misstate the disclosure. Financial and commitment report.
The filing assigns the Founder LLC 50.1% of general voting power, alongside separate Class T director rights. Valuation, funding needs, dilution and governance therefore deserve analysis beyond the first-day price move. Neither revenue growth nor a large order book settles those questions.
What this means for Anthropic’s first trading day
Start with the final offer price when it is announced. Then record the first exchange trade and regular-session close separately. A strong opening premium shows that buyers paid above the allocation price. It does not tell us whether the stock will keep rising after trading begins.
There is no defensible debut price target for Anthropic in this dataset. Fifteen observations, selected by annual deal size, cannot supply calibrated odds. Differences in business model, valuation, share supply and market conditions make a simple transfer of past IPO returns especially weak.
For a longer investment horizon, the prospectus matters beyond the debut. Examine revenue quality, compute expenses, operating losses, dilution, voting rights and the use of proceeds. First-day demand and long-term business value answer different questions. A successful debut cannot settle the valuation question.
For broader context, the Nasdaq return history and S&P 500, Dow and Nasdaq comparison describe market cycles. This IPO study does not subtract same-day benchmark returns, so its results should not be interpreted as market-adjusted outperformance.
Data, calculations and source checks
The window covers five calendar years, January 1, 2022 through November 17, 2026. It is not five completed years or the fifteen largest offerings across the entire period. Returning issuers such as Arm and Mobileye are included because their prior publicly traded businesses had been taken private. Operating REIT Lineage is included.
Offer-to-close return equals (first-day close ÷ offer price − 1) × 100. Opening-to-close return substitutes the first exchange trade for the offer price. Prices are contemporaneous nominal quotations, without later dividend or split adjustments. Returns exclude commissions, spread, slippage and taxes; an actual fill can differ from the recorded opening trade.
Annual rankings were checked against IPO research listings. Offering terms use issuer announcements where available; opening and closing prices use contemporaneous market reporting. Venture Global’s $24.00 closing price follows Bloomberg and MarketWatch; an Investopedia article gives a conflicting $23.94. Corebridge uses Bloomberg’s $20.73 debut close, rather than a vendor summary showing next-day prices.
The equal-year sample is small, spans different industries and market conditions, and does not control for valuation, float or broader market returns. Its historical frequencies are descriptive. They are not a trained model, calibrated odds or evidence of a trading strategy’s profitability.
Open the source list for all 15 IPOs
Ranking references: Renaissance Capital rankings · Renaissance Capital 2022 · Renaissance Capital 2023 · 2026 listing review
- Corebridge Financial · 2022-09-15 — Offering terms / size · Opening trade · Closing report
Opening trade and closing price from contemporaneous reporting. Some vendor summaries incorrectly show September 16 prices as debut-day prices.
- TPG · 2022-01-13 — Offering terms / size · Opening trade · Closing report
- Mobileye · 2022-10-26 — Offering terms / size · Opening trade · Closing report
- Arm · 2023-09-14 — Offering terms / size · Opening trade · Closing report
- Kenvue · 2023-05-04 — Offering terms / size · Opening trade · Closing report
- Birkenstock · 2023-10-11 — Offering terms / size · Opening trade · Closing report
- Lineage · 2024-07-25 — Offering terms / size · Opening trade · Closing report
- Viking · 2024-05-01 — Offering terms / size · Opening trade · Closing report
- StandardAero · 2024-10-02 — Offering terms / size · Opening trade · Closing report
- Medline · 2025-12-17 — Offering terms / size · Opening trade · Closing report
- Venture Global · 2025-01-24 — Offering terms / size · Opening trade · Closing report
Uses $24.00 regular-session close reported by Bloomberg and MarketWatch. An Investopedia report gives $23.94; that conflicting figure is not used.
- CoreWeave · 2025-03-28 — Offering terms / size · Opening trade · Closing report
- SpaceX · 2026-06-12 — Offering terms / size · Opening trade · Closing report
- Cerebras · 2026-05-14 — Offering terms / size · Opening trade · Closing report
- INNIO · 2026-06-04 — Offering terms / size · Opening trade · Closing report
This research is for educational purposes only and does not constitute financial advice. Historical debut returns do not predict Anthropic’s performance. Offering terms and expected dates can change.