Dow Jones Research
Dow Jones Industrial Average history and research on covered companies classified in the Dow.
Essential perspectives
Index-level research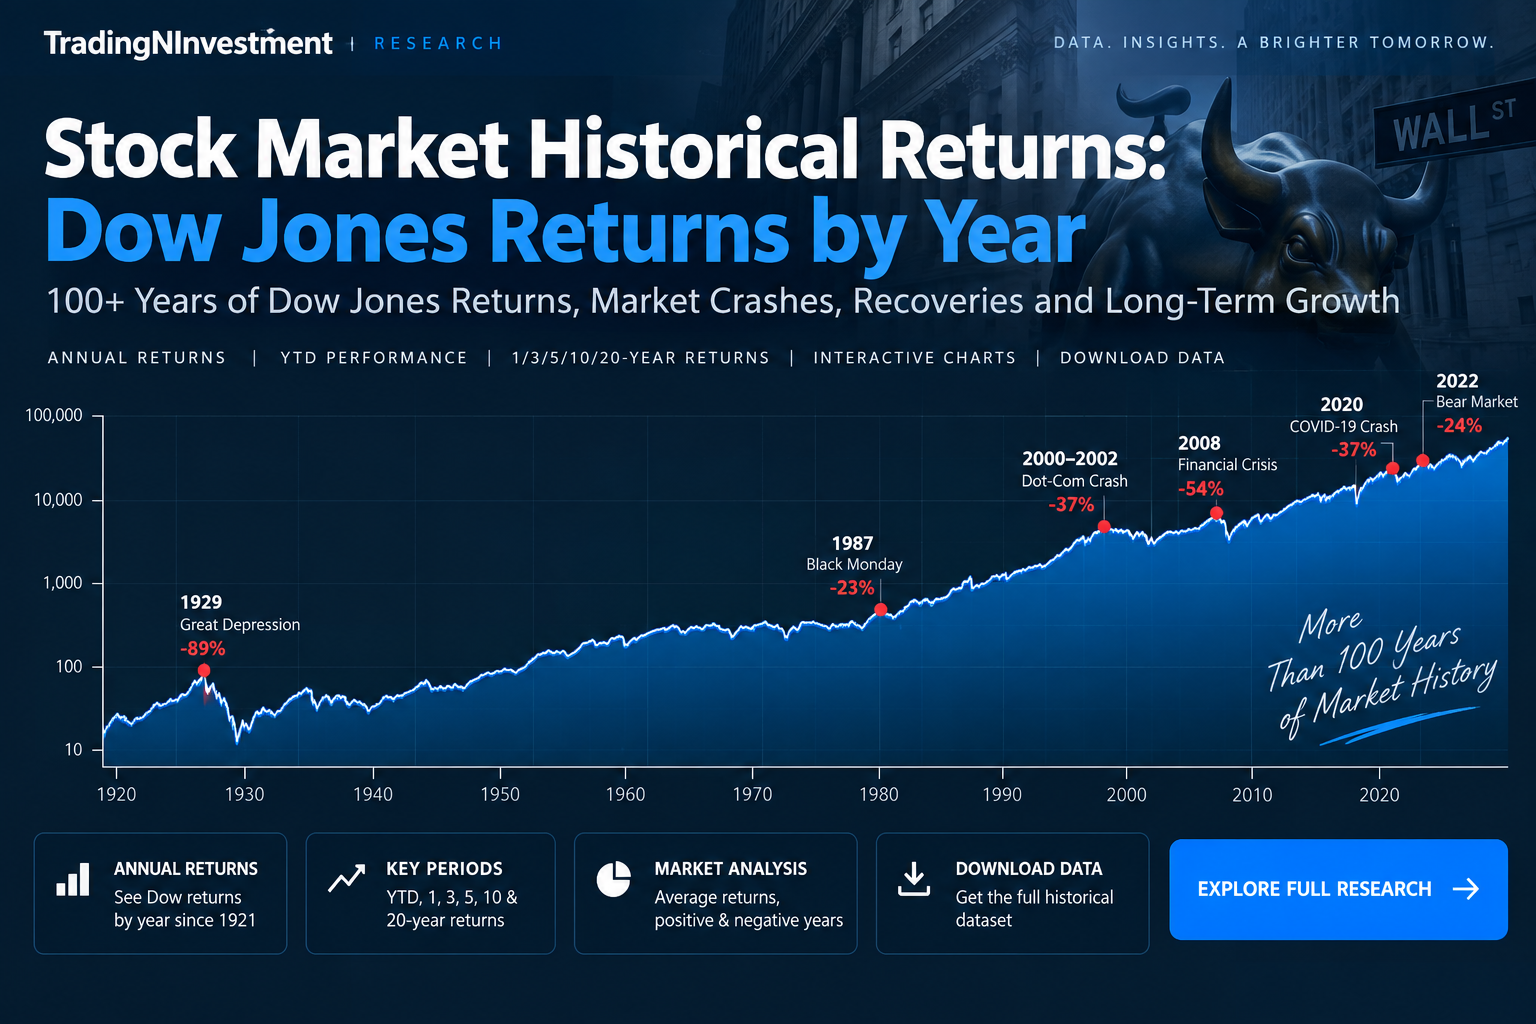
Stock Market Historical Returns: Dow Jones Returns by Year (1921–2026)
Dow Jones historical returns by year from 1921 to present, including 1-year, 3-year, 5-year, 10-year and 20-year performance, average returns, positive and negative years, and 2026 YTD performance.

100 Years of Dow Jones Industrial Average: Events, History & Charts (1920–2026)
Explore Dow Jones history from 1920 to 2026, including major market events, historical charts, crashes, and recoveries.
Explore the complete collection
Index-level studies
Returns, risk, seasonality, and market history.
Explore the collectionBrowse by sector
Explore company research by sector. Select a collection with published studies.
Explore the collectionFind a company
Find company research by name or ticker.
Explore the collectionAll index studies
Dow Jones Industrial Average history and research on covered companies classified in the Dow.
Start with a question.
The original historical perspective
1920–1940
The original TNI chart traces the Dow through the 1920s expansion, the 1929 peak, and the decline into 1932. Historical index levels, not total returns or present market conditions. Explore Dow Jones annual returns → Explore the historical analysis ↗