Tesla, Inc. Historical Returns: What the Available Market History Shows
The history of Tesla, Inc. returns shows how annual performance has varied across the available historical record.
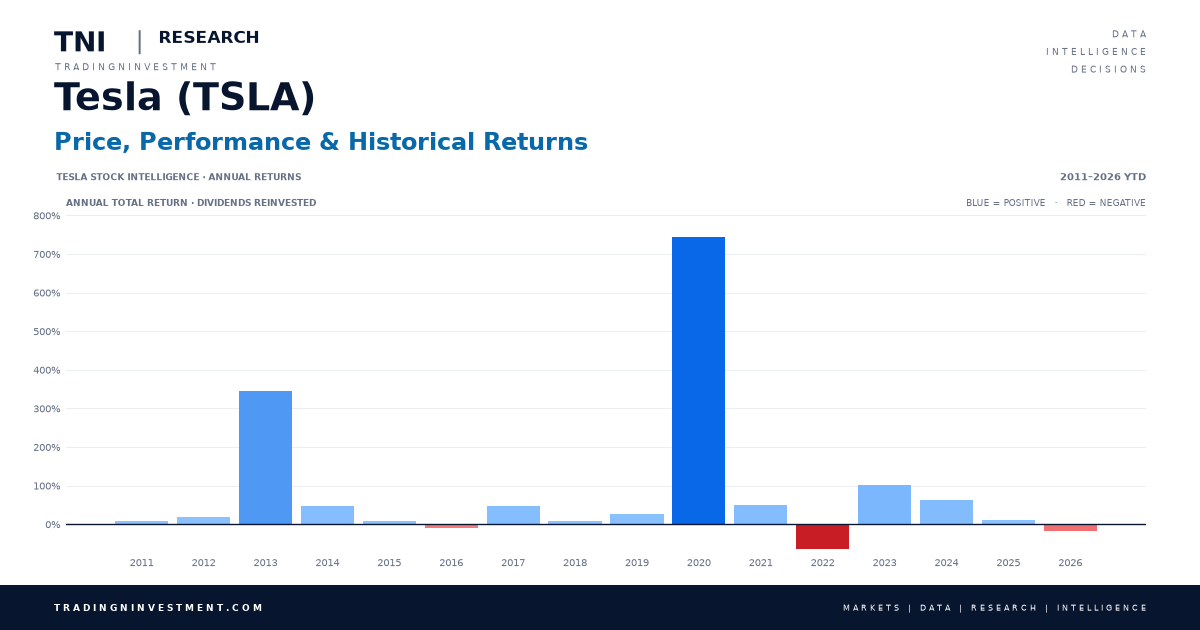
This Tesla, Inc. yearly returns database contains 15 completed calendar years from 2011 through 2025, plus the current 2026 year-to-date observation.
Across those 15 completed years, the average annual Tesla, Inc. price return was +93.12%.
The median annual return was +25.70%.
Those summary statistics are useful, but the complete Tesla, Inc. annual-return history provides more detail about how yearly performance has varied across the available record.
Looking at individual annual observations makes it possible to compare yearly outcomes using the same verified historical dataset.
Positive Tesla, Inc. Years: Average Return +113.29%
One of the strongest findings in the historical Tesla, Inc. returns dataset is the frequency of non-negative calendar years.
Of the 15 completed calendar years, 13 were non-negative.
That represents 86.67% of all completed years in the historical dataset.
In other words, roughly two-thirds of the completed calendar-year observations finished at or above where they began.
Across those 13 non-negative years, the average annual Tesla, Inc. price return was +113.29%.
The median return among those non-negative years was +45.70%.
That median is useful because it shows that the positive-year average was not driven solely by a small number of extraordinary market gains.
Strongest Positive Tesla, Inc. Year
The strongest completed year in the entire dataset was 2020, when the Tesla, Inc. price return reached +743.44%.
For this research, a zero return is included in the non-negative group.
Negative Tesla, Inc. Years: Average Loss -38.00%
Negative years tell the other side of Tesla, Inc. performance history.
Across the same 15 completed calendar years, 2 years were negative.
That represents 13.33% of completed years.
Looking only at those 2 negative years, the average annual Tesla, Inc. price return was -38.00%.
The median negative-year return was -38.00%.
These figures show that a negative calendar year historically meant considerably more than simply finishing slightly below zero.
Worst Tesla, Inc. Year
The worst calendar year in the dataset was 2022, when the Tesla, Inc.price return fell -65.03%.
Negative calendar years occurred less frequently than non-negative calendar years, but several historical losses were substantial.
What Positive and Negative Tesla, Inc. Returns Show Together
Putting both groups together reveals one of the most important characteristics of historical Tesla, Inc. returns.
There were 13 non-negative completed years compared with 2 negative completed years.
The average return during the 13 non-negative years was +113.29%.
The average return during the 2 negative years was -38.00%.
Across all 15 completed years together, the average annual Tesla, Inc. price return was +93.12%.
The median annual return across the full historical period was +25.70%.
An investor rarely experiences the long-term historical average in any particular calendar year.
Instead, individual Tesla, Inc. annual returns can vary substantially around that average.
That is one reason the complete Tesla, Inc. historical returns by year table can be more informative than relying on a single long-term number.
What Does the Tesla, Inc. Average Return of +93.12% Mean?
Across the 15 completed calendar years in this dataset, the arithmetic Tesla, Inc. average return was +93.12% per completed calendar year.
This is the arithmetic average of the individual annual price returns in the historical dataset.
It does not mean the market gained exactly 93.12% in a typical year.
Individual Tesla, Inc. yearly returns frequently differed substantially from that number.
The median annual return of +25.70% provides a second way to evaluate the distribution.
Looking at both the average and median gives readers more information about historical Tesla, Inc. returns than either statistic provides by itself.
These figures represent Tesla, Inc. price returns, not total returns.
Tesla, Inc. 3-Year Return View
The current Tesla, Inc. 3-year return view covers 2024 through 2026 YTD.
Within that window, there are 2 completed calendar years.
The average annual price return across those completed years was +36.94%.
The median annual return was +36.94%.
2 of the 2 completed years were non-negative, representing 100.00% of completed observations.
0 completed years were negative, representing 0.00%.
The strongest completed year in the period was 2024 at +62.52%.
The weakest completed year was 2025 at +11.36%.
The current 2026 YTD return of -17.60% remains separate from those completed-year statistics.
3-Year Average Return Is Not the Same as 3-Year CAGR
The +36.94% figure is the arithmetic average of the completed annual price returns in this display window. It should not be described as a 3-year cumulative return or compound annual growth rate.
A true 3-year cumulative return or CAGR requires a different calculation.
This completed-year sample can be compared with the full 15-year historical record when interpreting recent-period results.
Tesla, Inc. 5-Year Return View
The current Tesla, Inc. 5-year return view covers 2022 through 2026 YTD.
Within that window, there are 4 completed calendar years.
The average annual price return across those completed years was +27.64%.
The median annual return was +36.94%.
3 of the 4 completed years were non-negative, representing 75.00% of completed observations.
1 completed year was negative, representing 25.00%.
The strongest completed year in the period was 2023 at +101.72%.
The weakest completed year was 2022 at -65.03%.
The current 2026 YTD return of -17.60% remains separate from those completed-year statistics.
5-Year Average Return Is Not the Same as 5-Year CAGR
The +27.64% figure is the arithmetic average of the completed annual price returns in this display window. It should not be described as a 5-year cumulative return or compound annual growth rate.
A true 5-year cumulative return or CAGR requires a different calculation.
This completed-year sample can be compared with the full 15-year historical record when interpreting recent-period results.
Tesla, Inc. 10-Year Return View
The current Tesla, Inc. 10-year return view covers 2017 through 2026 YTD.
Within that window, there are 9 completed calendar years.
The average annual price return across those completed years was +109.12%.
The median annual return was +45.70%.
8 of the 9 completed years were non-negative, representing 88.89% of completed observations.
1 completed year was negative, representing 11.11%.
The strongest completed year in the period was 2020 at +743.44%.
The weakest completed year was 2022 at -65.03%.
The current 2026 YTD return of -17.60% remains separate from those completed-year statistics.
10-Year Average Return Is Not the Same as 10-Year CAGR
The +109.12% figure is the arithmetic average of the completed annual price returns in this display window. It should not be described as a 10-year cumulative return or compound annual growth rate.
A true 10-year cumulative return or CAGR requires a different calculation.
This completed-year sample can be compared with the full 15-year historical record when interpreting recent-period results.
Best and Worst Tesla, Inc. Annual Returns
The strongest calendar-year price return in the dataset occurred in 2020 at +743.44%.
The worst annual price return occurred in 2022 at -65.03%.
These extremes are far removed from the full-dataset Tesla, Inc. average return of +93.12%.
Tesla, Inc. Price Return vs. Total Return
Understanding the type of return used on this page is essential.
The historical figures presented here are Tesla, Inc. price returns.
Price return measures the change in the market price of the asset between periods.
The figures on this page do not include dividends.
Therefore, these results should not be interpreted as Tesla, Inc. total returns.
A total-return series would incorporate dividends or other distributions according to the methodology of that series.
The chart, historical table, filters, and statistics on this page represent Tesla, Inc. price performance only.
Tesla, Inc. Return 2026 YTD
The current dataset shows the Tesla, Inc. return for 2026 at -17.60% YTD through Oct 2, 2026.
Unlike the completed historical calendar-year observations, 2026 is still in progress.
TradingNInvestment therefore displays the 2026 YTD return separately.
It is excluded from calculations such as the historical average, median, best completed year, and worst completed year.
This prevents a partial-year observation from being treated as though it were directly comparable with a completed calendar year.
The 2026 YTD result can change when the underlying verified market data is updated.
Why the Median Tesla, Inc. Annual Return Matters
Average return is one of the most commonly quoted historical stock market statistics.
But the median provides useful additional information.
Across the 15 completed years, the median annual Tesla, Inc. price return was +25.70%, compared with an average of +93.12%.
The difference indicates that the distribution of historical annual returns is not perfectly symmetrical.
Large negative years can pull the arithmetic average downward.
Average, median, positive-year frequency, negative-year frequency, best year, and worst year together provide a more complete view of historical Tesla, Inc. returns.
No single statistic captures the entire history.
How Often Have Tesla, Inc. Returns Been Positive?
The dataset contains 13 non-negative years out of 15 completed years.
That corresponds to 86.67% of completed calendar years.
This is a historical frequency, not a probability forecast.
It would be incorrect to say that Tesla, Inc. has a 86.67% probability of rising next year simply because 86.67% of these historical observations were non-negative.
Future market conditions can differ substantially from historical conditions.
The statistic describes what occurred across the observed period, not what must happen in the future.
Why Study Historical Tesla, Inc. Returns?
Historical Tesla, Inc. returns provide context that recent performance alone cannot provide.
A large gain or decline can appear unusual when viewed only against the most recent observations.
Comparing the current period with the available historical distribution helps show how it relates to earlier outcomes.
Historical returns can help investors, researchers, students, and analysts examine how annual performance has varied through the available record.
They can also reduce the tendency to use only recent performance as the reference point for evaluating the current year.
How to Use the Tesla, Inc. Return Explorer
The TradingNInvestment Return Explorer is designed to make historicalTesla, Inc. returns easier to investigate.
Instead of presenting only a static chart, the tool allows readers to filter the same verified annual-return dataset.
Readers can examine all available years, non-negative years, negative years, and available historical periods.
The chart, annual-returns table, and summary statistics update from the same selected data.
Readers interested in downside history can examine the 2 negative calendar years in the completed-year dataset.
Readers studying non-negative historical performance can examine the 13 non-negative calendar years in the completed-year dataset.
When sufficient history is available, readers can also use the available period views to focus on more recent performance.
The purpose is not to predict the next Tesla, Inc. return, but to make the available historical observations easier to explore and understand.
Reading Tesla, Inc. Performance History in Context
One of the biggest risks when studying historical returns is selecting a period that confirms an existing belief.
A short period can appear exceptionally strong or exceptionally weak depending on its starting and ending years.
Using the broader available Tesla, Inc. history provides additional context for interpreting shorter periods.
Different historical windows can produce different average returns, frequencies of positive and negative years, and extreme outcomes.
None of those periods is inherently the single correct measure of historical performance. They answer different questions about different parts of the available record.
This is why TradingNInvestment provides both the available historical series and interactive period filters.
What the Available Tesla, Inc. Return History Shows
The dataset contains 15 completed calendar years of Tesla, Inc. price-return observations.
Of those completed years, 13 were non-negative and 2 were negative.
When completed years were non-negative, the average annual return was +113.29%.
When completed years were negative, the average annual return was -38.00%.
The strongest completed calendar year in the dataset was 2020 at +743.44%, while the weakest was 2022 at -65.03%.
The overall average annual Tesla, Inc. price return across the 15 completed calendar years was +93.12%.
Together, these statistics provide a broader view of the historical return distribution than the average alone.
The complete Tesla, Inc. annual-return dataset allows readers to examine the individual yearly observations behind the summary statistics.
TradingNInvestment aims to make market history simple to read, easy to understand, and rigorous enough to support serious market research.