Average Stock Market Return:S&P 500 Returns by Year
Market data through Oct 16, 2026
Explore U.S. stock market returns from 1872 through 2026 YTD, comparing total return with dividends reinvested, inflation-adjusted real total return, and price return.
Total return is the primary measure in this research because it includes reinvested dividends. Real total return shows the historical result after inflation, while price return is provided as a comparison benchmark.
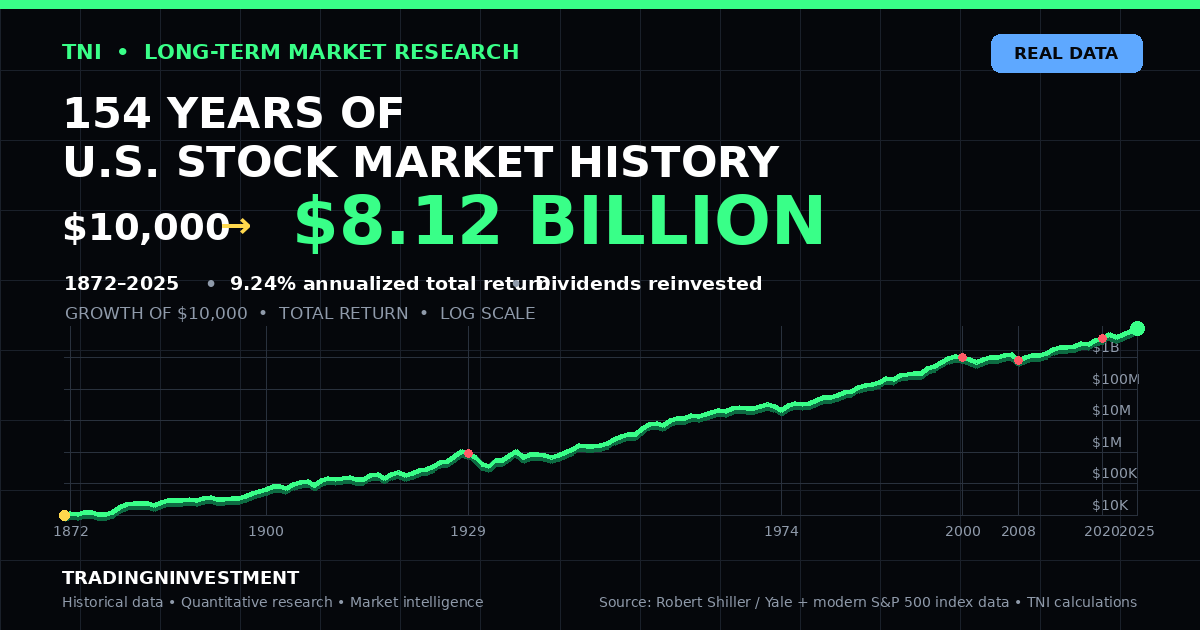
154 years · 1872–2025 · $10,000 compounded to $8.12 billion using annual total returns with dividends reinvested. Chart uses a logarithmic wealth scale.
Download TNI ChartPERFORMANCE
PERIOD
Three return measures: Price Return measures changes in the market index level and excludes reinvested dividends. Total Return includes dividends and assumes they are reinvested. Real Total Return starts with dividend-reinvested total return and adjusts it for inflation. These are distinct measures and should not be interpreted interchangeably.
Loading interactive chart…
Understanding the Average Stock Market Return
The average stock market return depends on what we mean by “return.” A price index measures how stock prices changed, but price appreciation alone does not represent the full historical return earned by an investor.
Investors may also receive dividends, reinvest those dividends, and experience changes in purchasing power caused by inflation. For that reason, looking only at price return can leave out two important forces that shape long-term investment results: dividend compounding and inflation.
When evaluating the historical average stock market return, the measurement method matters. S&P 500 price return reflects changes in index prices, while S&P 500 total return includes reinvested dividends.
Inflation-adjusted total return, also called real total return, measures the return remaining after accounting for changes in purchasing power. Comparing these measures across different time periods provides a more complete picture of historical stock market performance than relying on a single average return.
In this analysis, total return is the primary measure of stock market performance. Real total return—the return after inflation—is the second major measure. Price return is included as a comparison benchmark.
Total return incorporates dividends and assumes those distributions are reinvested, allowing the effect of compounding to become part of the historical return. Real total return goes one step further by adjusting those investment results for inflation, providing a measure of how much purchasing power an investor actually gained or lost.
These differences become increasingly important over long investment horizons. Reinvested dividends can compound for decades, potentially creating a substantial gap between the movement of a price index and the accumulated return of an investor.
Inflation works in the opposite direction by reducing the purchasing power of accumulated wealth.
The interactive chart above therefore lets you examine the historical market from three perspectives—Total Return (Dividends Reinvested), Real Total Return (Inflation Adjusted), and Price Return—and change the historical period to see how the results differ.
The purpose of this research is therefore broader than simply measuring how much the S&P 500 price index rose or fell. It asks a more useful long-term question: What has the U.S. stock market historically returned to investors after accounting for dividends, compounding, and inflation?
The sections below examine that question across different investment horizons and historical market environments. Historical returns provide useful context for understanding long-term market behavior, but they are not forecasts of future returns.
Interactive TOTAL RETURN Statistics
Statistics below update with the selected return method and filters. Average, median, best and worst annual returns use completed calendar years only, so the current YTD period does not distort historical annual statistics.
Average Annual Return+10.88%154 completed years
Median Annual Return+12.08%Completed years only
Positive Years11373.38% of completed years
Negative Years4126.62% of completed years
Best Year+52.56%1954
Worst Year-43.84%1931
What does Total Return mean?
Total return measures market performance including dividends reinvested. It is the broadest nominal measure of long-run shareholder return in this dataset.
Latest observation: 2026 YTD — +12.91%. Data through 2026-10-16.
Stock Market Returns Over Different Time Periods
Compare annualized historical stock market returns across multiple investment horizons. Price return measures index price changes, total return includes reinvested dividends, and real total return adjusts for inflation.
| Period | Years | Price Return | Total Return | After Inflation |
|---|---|---|---|---|
| YTD | 2026 YTD | +11.89% | +12.91% | +8.43% |
| 1 Year | 2025 | +16.39% | +17.88% | +14.81% |
| 2 YearsAnnualized | 2024–2025 | +19.80% | +21.40% | +18.11% |
| 3 YearsAnnualized | 2023–2025 | +21.26% | +23.01% | +19.46% |
| 5 YearsAnnualized | 2021–2025 | +12.75% | +14.40% | +9.48% |
| 10 YearsAnnualized | 2016–2025 | +12.85% | +14.73% | +11.15% |
| 20 YearsAnnualized | 2006–2025 | +8.88% | +10.93% | +8.19% |
| 30 YearsAnnualized | 1996–2025 | +8.36% | +10.27% | +7.54% |
| 50 YearsAnnualized | 1976–2025 | +9.04% | +11.93% | +8.04% |
| 100 YearsAnnualized | 1926–2025 | +6.50% | +10.29% | +7.14% |
| 150 YearsAnnualized | 1876–2025 | +5.02% | +9.36% | +6.91% |
| Full HistoryAnnualized | 1872–2025 | +4.83% | +9.24% | +6.96% |
How to read this table: YTD shows the actual return recorded for the current partial year. Multi-year periods show compounded annualized returns using completed calendar years.
The Full History row begins with the earliest completed observation available in this research dataset and ends with the latest completed calendar year. The date range updates automatically with the underlying dataset.
What Do These Historical Returns Mean?
Stock market returns can look very different depending on the time period and how returns are measured. Short-term results can change substantially from year to year, while longer periods provide a broader view of how U.S. stocks performed across many different market environments.
Price return measures only the change in stock prices. Total return includes dividends and assumes those dividends are reinvested.
Over long periods, the difference between these measures shows how dividends and compounding contributed to historical investor returns. Real total return adjusts total return for inflation, providing a view of how purchasing power changed.
Over the latest 20 completed years, from 2006 through 2025, the market produced an annualized total return of +10.93%, compared with an annualized price return of +8.88% and an inflation-adjusted annualized total return of +8.19%.
Across the full historical dataset from 1872 through 2025, the annualized price return was +4.83%, while the annualized total return with dividends reinvested was +9.24%. After adjusting for inflation, the annualized real total return was +6.96%.
This is why the answer to “What is the average stock market return?” depends on whether return means price appreciation, total return with dividends, or return after inflation.
Historical returns are not forecasts. These results describe what happened over the periods shown. They include strong bull markets, market declines, recessions, inflationary periods, financial crises and recoveries. Future returns can differ substantially from historical averages.
How Dividends Changed Long-Term Stock Market Returns
Stock-price appreciation tells only part of the historical return story. Investors may also receive dividends, and when those dividends are reinvested they purchase additional shares that can participate in future price gains and future dividends.
TNI separates price return from total return so the effect of reinvested dividends can be seen directly. Price return measures changes in market prices alone. Total return includes dividends and assumes those distributions are reinvested.
Across long holding periods, even a modest difference in annualized return can produce a very large difference in ending wealth because each year's return compounds on the value created in previous years.
HISTORICAL COMPOUNDING COMPARISON
What $10,000 Would Have Become: Price Return vs. Total Return
Hypothetical growth across the 154 completed annual observations from 1872 through 2025.
COMPOUNDING DIFFERENCE$8,110,406,398
Difference between the hypothetical ending values produced by the dividend-reinvested total-return series and the price-only series.
RETURNS BY INVESTMENT PERIOD
Stock Market Returns With and Without Dividends by Investment Period
This historical comparison shows how a hypothetical $10,000 investment would have grown using price return alone versus total return with dividends reinvested. Each investment period is calculated independently from completed calendar-year observations, allowing direct comparison of the effect of dividend reinvestment across short- and long-term holding periods.
| PERIOD | PRICE RETURN | TOTAL RETURN | DIVIDEND + REINVESTMENT |
|---|---|---|---|
| 1 Year2025–2025 | $11,63916.39% return | $11,78817.88% return | +$1491.3% contribution |
| 2 Years2024–2025 | $14,35219.80% CAGR | $14,73721.40% CAGR | +$3862.6% contribution |
| 3 Years2023–2025 | $17,82921.26% CAGR | $18,61123.01% CAGR | +$7824.2% contribution |
| 5 Years2021–2025 | $18,22512.75% CAGR | $19,59714.40% CAGR | +$1,3727.0% contribution |
| 10 Years2016–2025 | $33,49212.85% CAGR | $39,50614.73% CAGR | +$6,01515.2% contribution |
| 30 Years1996–2025 | $111,1418.36% CAGR | $187,90110.27% CAGR | +$76,76140.9% contribution |
| 50 Years1976–2025 | $759,0089.04% CAGR | $2.81M11.93% CAGR | +$2.05M72.9% contribution |
| 100 Years1926–2025 | $5.43M6.50% CAGR | $179.85M10.29% CAGR | +$174.42M97.0% contribution |
| 150 Years1876–2025 | $15.49M5.02% CAGR | $6.76B9.36% CAGR | +$6.75B99.8% contribution |
| Full History · 154 Years1872–2025 | $14.28M4.83% CAGR | $8.12B9.24% CAGR | +$8.11B99.8% contribution |
How to Read This Table
Every row begins with the same hypothetical $10,000 investment and compounds the completed annual observations for that period. The Price Return column shows the ending value and annualized return from market-price changes alone. The Total Return column shows the ending value and annualized return when dividends are reinvested.
The Dividend + Reinvestment column is the difference between those two ending wealth paths. Its contribution percentage measures the share of ending total-return wealth represented by that difference. It is not a historical dividend yield and should not be interpreted as a standalone dividend return.
Across the full 154-year completed history from 1872 through 2025, the hypothetical $10,000 price-only investment grew to $14.28M, compared with $8.12B using the dividend-reinvested total-return series. The +$8.11B difference represents 99.8% of ending total-return wealth in this historical comparison.
What the Historical Data Shows
Over the full 154-year completed history from 1872 through 2025, a hypothetical $10,000 following the price-return series grew to approximately $14.28M. Using the dividend-reinvested total-return series, the same hypothetical starting investment grew to approximately $8.12B.
The difference between these two historical wealth paths was approximately +$8.11B. That difference represents 99.8% of ending total-return wealth in this historical comparison.
The dividend + reinvestment contribution is not a dividend yield or a standalone dividend return. It measures the difference between the dividend-reinvested total-return wealth path and the price-only wealth path, including the long-term compounding effect of reinvested dividends.
Historical results are hypothetical and do not include taxes, fees, transaction costs or other investor-specific effects. Past performance is not a forecast of future returns.
Why Reinvested Dividends Matter
Over the completed historical period from 1872 through 2025, the annualized price return was +4.83%, compared with an annualized total return of +9.24% when dividends were reinvested.
The gap between those annualized returns may appear relatively small when viewed one year at a time. Over many decades, however, compounding repeatedly applies that difference to an increasingly larger base. That is why long-run price-index performance and long-run investor total return can tell very different stories.
Dividend reinvestment does not eliminate market risk. Total-return investors still experienced major bear markets, recessions and financial crises. The comparison isolates how the treatment of dividends changes the measurement of historical market performance.
RECENT PERSPECTIVE
During the latest 20 completed years, from 2006 through 2025, annualized total return was +10.93%, compared with annualized price return of +8.88%.
Methodology note: This is a historical illustration based on TNI's annual return series, not the performance of an investable account. It assumes annual compounding and, for total return, reinvestment of dividends. It does not include taxes, transaction costs, management fees or investor cash flows.
Historical results do not predict future returns.
How TNI Constructed This Historical Stock Market Return Dataset
This dataset combines historical U.S. equity-market observations, predecessor large-cap index history, modern S&P 500 index observations and U.S. inflation data. TNI keeps the historical reconstruction separate from the modern S&P 500 series so the provenance of the long-run record remains explicit.
TNI RESEARCH STANDARDSOURCED · REPRODUCIBLE · CROSS-CHECKED · UPDATED
Historical Coverage and Construction
Robert Shiller/Yale historical U.S. equity-market observations. TNI reconstructs annual price and dividend-reinvested returns from monthly observations. This period is not represented as the modern S&P 500.
TNI conventional annual price returns combined with Aswath Damodaran/NYU Stern dividend-inclusive large-cap/S&P returns.
Yahoo Finance S&P 500 Price Index (^GSPC), S&P 500 Total Return Index (^SP500TR), and BLS CPI-U via FRED.
For the earliest historical period, TNI reconstructs annual returns from Robert Shiller / Yale monthly U.S. equity-market observations. This historical extension represents the broader U.S. equity market and is not presented as the modern S&P 500.
The conventional historical period combines TNI annual price-return history with Aswath Damodaran / NYU Stern dividend-inclusive large-cap / S&P return data. The modern period uses observations for the S&P 500 Price Index and S&P 500 Total Return Index.
Data Sources
The source used depends on the return component and historical period. TNI then standardizes these observations into the common annual dataset used by the charts, tables and calculations on this page.
| Data Component | Source | Use in TNI Research |
|---|---|---|
| Early U.S. equity history | Robert J. Shiller — Historical U.S. Stock Market Data Yale University — Robert J. Shiller | Monthly price, dividend and inflation observations used for the historical U.S. equity-market extension. |
| Historical dividend-inclusive returns | Aswath Damodaran / NYU Stern | Historical large-cap / S&P dividend-inclusive return observations. |
| Modern S&P 500 price observations | Yahoo Finance — ^GSPC | Modern S&P 500 Price Index observations used to calculate price returns. |
| Modern S&P 500 total-return observations | Yahoo Finance — ^SP500TR | Modern S&P 500 Total Return Index observations used for dividend-reinvested returns. |
| U.S. inflation | U.S. BLS CPI-U via FRED | Consumer Price Index data used to convert nominal total returns into real, inflation-adjusted returns. |
| Index methodology reference | S&P Dow Jones Indices | Reference source for S&P index definitions and methodology. |
| Derived research calculations | TradingNInvestment Research | Annual return transformations, real returns, CAGR, averages, statistics, historical summaries and interactive analytics. |
Yahoo Finance is used as a retrieval source for modern index observations. S&P Dow Jones Indices defines and maintains the underlying S&P index methodology.
Return Calculation
Price return measures the change in the market index level. Total return includes dividends and assumes those distributions are reinvested. Real total return adjusts the dividend-reinvested total return for changes in consumer prices.
Real total return = (1 + total_return) / (1 + inflation) - 1
Current-Year and Inflation Alignment
The newest observation is year-to-date rather than a completed calendar year. Market price and total-return data are through 2026-10-16. Inflation data are available through 2026-09. To avoid combining market and inflation observations from different endpoints, the current real-return calculation uses market data aligned through 2026-09-30.
Verification and Research Controls
Historical and modern observations retain their source and methodology distinctions rather than being presented as one uninterrupted modern index series.
TNI checks the historical series for chronological continuity before the derived research dataset is generated.
Modern and historical return observations are cross-checked against independent reference data where appropriate before publication.
Completed-year statistics exclude the current partial year, while current YTD performance is identified separately throughout the research.
Real-return calculations align the market endpoint with the latest available inflation observation rather than mixing mismatched periods.
Charts, tables and summary statistics are generated from the same underlying return dataset instead of manually entered article values.
Source data providers supply underlying observations and reference series. Unless otherwise stated, calculations, transformations, historical comparisons, tables, visualizations and analytical summaries on this page are produced by TradingNInvestment Research.
Stock Market Returns by Year: Price, Dividends & Inflation
Compare annual U.S. stock market performance using three different measures: price return, total return with dividends reinvested, and real total return after inflation. The newest observation appears first so recent performance can be compared directly with the longer historical record.
| Year | Price Return | Total Return | Real Total Return |
|---|---|---|---|
| 2026 YTD · Through Oct 16, 2026 | +11.89% | +12.91% | +8.43% |
| 2025 | +16.39% | +17.88% | +14.81% |
| 2024 | +23.31% | +25.02% | +21.51% |
| 2023 | +24.23% | +26.29% | +22.19% |
| 2022 | -19.44% | -18.04% | -23.00% |
| 2021 | +26.89% | +28.47% | +19.85% |
| 2020 | +16.26% | +18.02% | +16.48% |
| 2019 | +28.88% | +31.21% | +28.24% |
| 2018 | -6.24% | -4.23% | -6.11% |
| 2017 | +19.42% | +21.61% | +19.07% |
| 2016 | +9.54% | +11.77% | +9.53% |
| 2015 | -0.73% | +1.38% | +0.74% |
| 2014 | +11.39% | +13.52% | +12.79% |
| 2013 | +29.60% | +32.15% | +30.18% |
| 2012 | +13.41% | +15.89% | +13.89% |
| 2011 | -0.00% | +2.10% | -0.94% |
| 2010 | +12.78% | +14.82% | +13.19% |
| 2009 | +23.45% | +25.94% | +22.49% |
| 2008 | -38.49% | -36.55% | -36.54% |
| 2007 | +3.53% | +5.48% | +1.32% |
| 2006 | +13.62% | +15.61% | +12.77% |
| 2005 | +3.00% | +4.83% | +1.45% |
| 2004 | +8.99% | +10.74% | +7.16% |
| 2003 | +26.38% | +28.36% | +25.80% |
| 2002 | -23.37% | -21.97% | -23.85% |
| 2001 | -13.04% | -11.85% | -13.24% |
| 2000 | -10.14% | -9.03% | -12.05% |
| 1999 | +19.53% | +20.89% | +17.73% |
| 1998 | +26.67% | +28.34% | +26.31% |
| 1997 | +31.01% | +33.10% | +30.88% |
| 1996 | +20.26% | +22.68% | +18.67% |
| 1995 | +34.11% | +37.20% | +33.81% |
| 1994 | -1.54% | +1.33% | -1.24% |
| 1993 | +7.06% | +9.97% | +6.96% |
| 1992 | +4.46% | +7.49% | +4.40% |
| 1991 | +26.31% | +30.23% | +26.47% |
| 1990 | -6.56% | -3.06% | -8.77% |
| 1989 | +27.25% | +31.48% | +25.65% |
| 1988 | +12.40% | +16.54% | +11.61% |
| 1987 | +2.03% | +5.81% | +1.42% |
| 1986 | +14.62% | +18.49% | +17.10% |
| 1985 | +26.33% | +31.24% | +26.44% |
| 1984 | +1.40% | +6.15% | +2.02% |
| 1983 | +17.27% | +22.34% | +17.87% |
| 1982 | +14.76% | +20.42% | +15.98% |
| 1981 | -9.73% | -4.70% | -12.50% |
| 1980 | +25.77% | +31.74% | +17.25% |
| 1979 | +12.31% | +18.52% | +4.65% |
| 1978 | +1.06% | +6.51% | -2.27% |
| 1977 | -11.50% | -6.98% | -12.80% |
| 1976 | +19.15% | +23.83% | +17.89% |
| 1975 | +31.55% | +37.00% | +27.88% |
| 1974 | -29.72% | -25.90% | -33.90% |
| 1973 | -17.37% | -14.31% | -21.34% |
| 1972 | +15.63% | +18.76% | +14.84% |
| 1971 | +10.79% | +14.22% | +10.61% |
| 1970 | +0.10% | +3.56% | -1.90% |
| 1969 | -11.36% | -8.24% | -13.35% |
| 1968 | +7.66% | +10.81% | +5.83% |
| 1967 | +20.09% | +23.80% | +19.87% |
| 1966 | -13.09% | -9.97% | -12.90% |
| 1965 | +9.06% | +12.40% | +10.28% |
| 1964 | +12.97% | +16.42% | +15.04% |
| 1963 | +18.89% | +22.61% | +20.63% |
| 1962 | -11.81% | -8.81% | -9.92% |
| 1961 | +23.13% | +26.64% | +25.79% |
| 1960 | -2.97% | +0.34% | -1.01% |
| 1959 | +8.48% | +12.06% | +10.38% |
| 1958 | +38.06% | +43.72% | +41.24% |
| 1957 | -14.31% | -10.46% | -13.10% |
| 1956 | +2.62% | +7.44% | +4.48% |
| 1955 | +26.40% | +32.60% | +32.10% |
| 1954 | +45.02% | +52.56% | +53.13% |
| 1953 | -6.62% | -1.21% | -1.80% |
| 1952 | +11.78% | +18.15% | +17.09% |
| 1951 | +16.35% | +23.68% | +16.72% |
| 1950 | +21.68% | +30.81% | +23.63% |
| 1949 | +10.46% | +18.30% | +20.51% |
| 1948 | -0.65% | +5.70% | +2.89% |
| 1947 | 0.00% | +5.20% | -3.34% |
| 1946 | -11.87% | -8.43% | -22.48% |
| 1945 | +30.72% | +35.82% | +32.84% |
| 1944 | +13.80% | +19.03% | +16.36% |
| 1943 | +19.45% | +25.06% | +21.47% |
| 1942 | +12.43% | +19.17% | +9.30% |
| 1941 | -17.86% | -12.77% | -20.65% |
| 1940 | -15.09% | -10.67% | -11.31% |
| 1939 | -5.17% | -1.10% | -1.10% |
| 1938 | +24.55% | +29.28% | +32.98% |
| 1937 | -38.59% | -35.34% | -37.13% |
| 1936 | +27.92% | +31.94% | +30.06% |
| 1935 | +41.37% | +46.74% | +42.49% |
| 1934 | -4.71% | -1.19% | -2.66% |
| 1933 | +44.08% | +49.98% | +48.85% |
| 1932 | -14.78% | -8.64% | +1.82% |
| 1931 | -47.07% | -43.84% | -38.07% |
| 1930 | -28.48% | -25.12% | -20.01% |
| 1929 | -11.91% | -8.30% | -8.83% |
| 1928 | +37.88% | +43.81% | +45.49% |
| 1927 | +29.43% | +35.79% | +38.93% |
| 1926 | +8.27% | +13.99% | +15.28% |
| 1925 | +22.64% | +29.15% | +24.82% |
| 1924 | +18.83% | +26.15% | +26.15% |
| 1923 | -2.62% | +3.49% | +1.09% |
| 1922 | +20.11% | +27.28% | +30.29% |
| 1921 | +7.34% | +15.16% | +29.14% |
| 1920 | -23.65% | -18.51% | -20.61% |
| 1919 | +12.91% | +20.21% | +4.94% |
| 1918 | +16.18% | +26.21% | +4.79% |
| 1917 | -30.61% | -25.19% | -36.66% |
| 1916 | +3.38% | +8.97% | -3.24% |
| 1915 | +28.98% | +35.79% | +33.15% |
| 1914 | -8.58% | -3.30% | -4.25% |
| 1913 | -14.29% | -9.31% | -11.99% |
| 1912 | +2.96% | +8.22% | +0.79% |
| 1911 | +0.66% | +5.91% | +8.14% |
| 1910 | -12.14% | -7.74% | -0.13% |
| 1909 | +14.06% | +19.12% | +7.78% |
| 1908 | +37.44% | +45.12% | +40.53% |
| 1907 | -33.23% | -29.48% | -27.94% |
| 1906 | +3.14% | +7.16% | +1.46% |
| 1905 | +15.64% | +19.84% | +19.84% |
| 1904 | +25.57% | +31.61% | +25.69% |
| 1903 | -18.39% | -14.39% | -9.35% |
| 1902 | +1.26% | +5.25% | -1.77% |
| 1901 | +15.72% | +20.40% | +14.67% |
| 1900 | +14.12% | +19.02% | +23.49% |
| 1899 | +6.55% | +10.08% | -5.83% |
| 1898 | +18.95% | +23.53% | +21.79% |
| 1897 | +12.56% | +17.22% | +17.22% |
| 1896 | -2.31% | +2.04% | +3.50% |
| 1895 | +0.47% | +4.99% | +2.04% |
| 1894 | -2.49% | +2.70% | +10.15% |
| 1893 | -19.96% | -15.70% | -8.86% |
| 1892 | +1.85% | +6.17% | +4.84% |
| 1891 | +17.61% | +22.87% | +29.09% |
| 1890 | -13.53% | -9.84% | -10.93% |
| 1889 | +3.50% | +7.96% | +14.54% |
| 1888 | -2.47% | +2.11% | +2.11% |
| 1887 | -6.56% | -2.48% | -8.09% |
| 1886 | +8.46% | +13.20% | +18.72% |
| 1885 | +19.82% | +27.18% | +28.65% |
| 1884 | -18.73% | -13.06% | -3.06% |
| 1883 | -8.56% | -3.13% | +4.86% |
| 1882 | -2.83% | +2.58% | +4.53% |
| 1881 | +2.91% | +7.83% | +0.78% |
| 1880 | +18.70% | +24.11% | +26.59% |
| 1879 | +42.61% | +49.41% | +25.97% |
| 1878 | +6.15% | +12.10% | +30.35% |
| 1877 | -9.22% | -1.97% | +10.77% |
| 1876 | -18.08% | -11.77% | -10.21% |
| 1875 | -3.74% | +3.27% | +8.66% |
| 1874 | +2.71% | +10.39% | +16.77% |
| 1873 | -12.82% | -6.85% | -1.03% |
| 1872 | +6.96% | +13.11% | +10.62% |
2026 is year-to-date. Market returns are through 2026-10-16. Inflation is available through 2026-09, so real total return is aligned through 2026-09-30.
What Does the Year-by-Year History Show?
From 1872 through 2025, this dataset contains 154 completed annual observations. Using total return, which includes reinvested dividends, 113 of those years were positive and 41 were negative.
That means the market produced a positive dividend-reinvested annual return in 73.4% of completed observations, compared with 26.6% that were negative. This describes historical frequency, not the probability of a positive return in any future year.
The strongest completed total-return year in the dataset was 1954 at +52.56%, while the weakest was 1931 at -43.84%.
Comparing the three columns year by year also shows why the definition of “stock market return” matters. Price return excludes dividends, total return includes reinvested dividends, and real total return shows what remained after inflation.
In some years, a positive nominal return can therefore translate into a much smaller gain in purchasing power.