S&P 500 RESEARCH

S&P 500 Monthly Returns

Historical S&P 500 monthly price returns from 1928 to present, including seasonal patterns, positive and negative month frequency, and current-month performance.

Research & Analysis by • Quant Researcher • TradingNInvestment

Independent quantitative researcher focused on historical market data, investment analysis, and risk.

Share this research
CURRENT MONTH

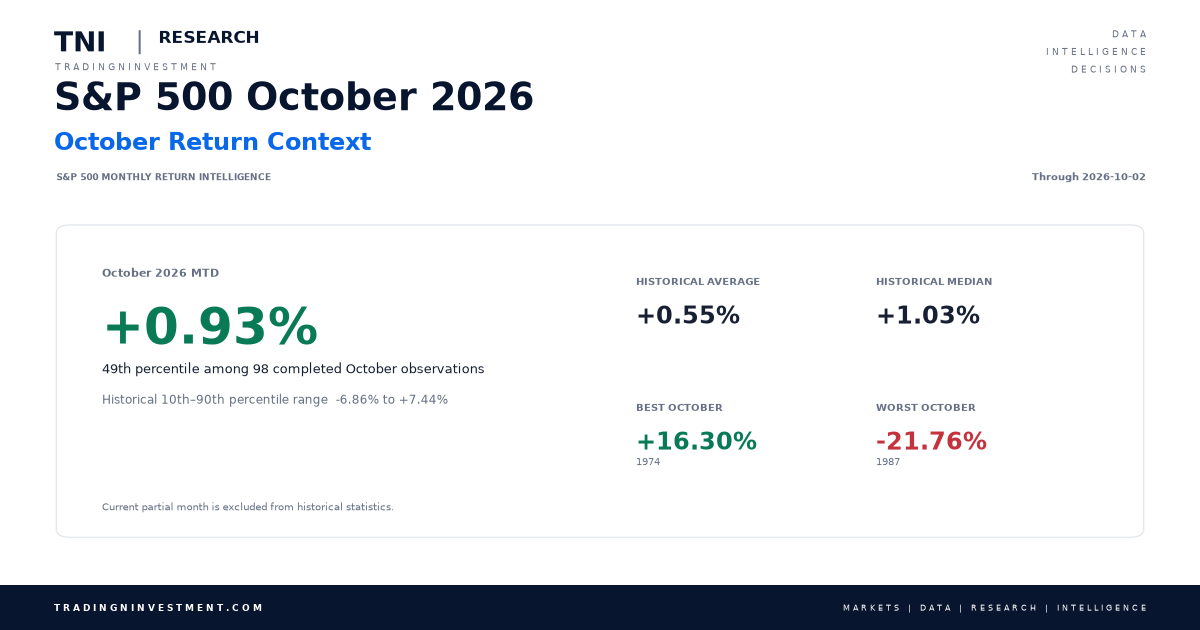
October 2026 MTD

Through 2026-10-05

+1.60%
Historical October Average+0.55%
Historically Positive59.18%
Historically Negative40.82%
Historical Observations98
RETURN CONTEXT

October vs History

Current month through 2026-10-05

+1.60%
Historical Median+1.03%
Historical Percentile54.1th
Best October+16.30%1974
Worst October-21.76%1987
Typical Historical Range-6.86% to +7.44%10th–90th percentile · 98 completed October observations
RISK CONTEXT

October Downside Risk

Current month through 2026-10-05

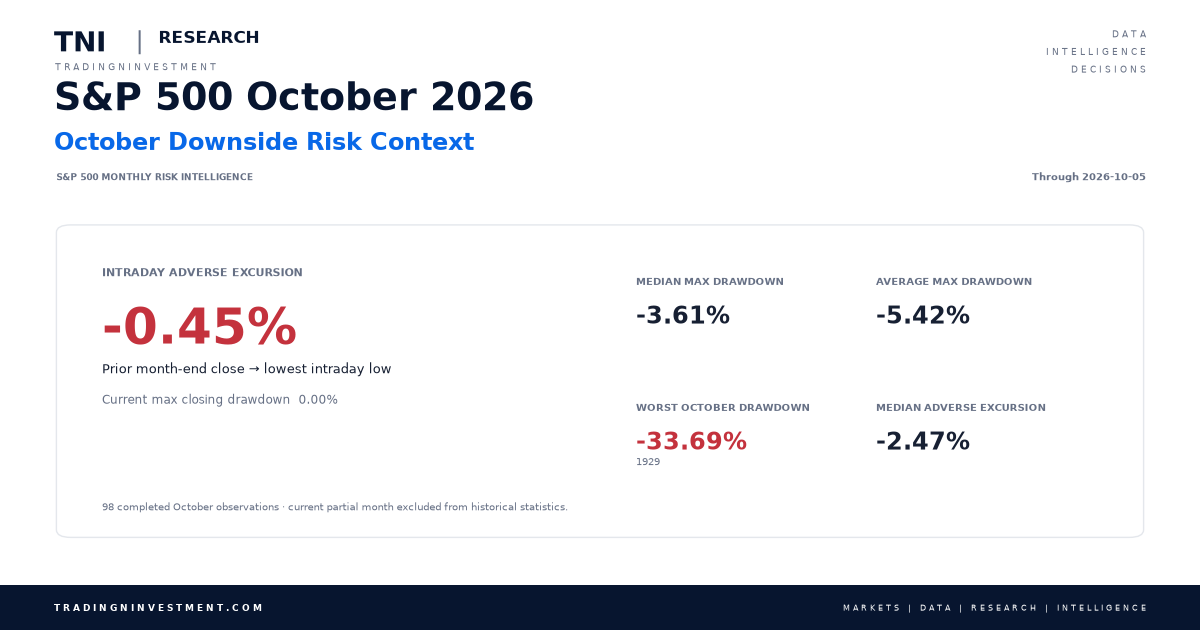
-0.45%
Max Closing Drawdown+0.00%
Intraday Adverse Excursion-0.45%
Historical Median Drawdown-3.61%
Historical Average Drawdown-5.42%
Worst Historical October Drawdown-33.69%1929 · 98 completed October observations

So far, this month's closing-price drawdown is shallower than every completed historical October observation in the dataset.

HISTORICAL MONTHLY PATTERNS

Which Months Have Historically Been Strongest and Weakest?

Frequency and average-return statistics use completed calendar months only. The current partial month is excluded.

MOST CONSISTENTLY POSITIVE

December

72.45%

Positive historical months

MOST CONSISTENTLY NEGATIVE

September

54.55%

Negative historical months

HIGHEST AVERAGE RETURN

July

+1.67%

Historical monthly average

LOWEST AVERAGE RETURN

September

-1.11%

Historical monthly average

MONTH-BY-MONTH PERFORMANCE

Average Return by Calendar Month

Historical average price return for each calendar month.

+1.21%
Jan
-0.11%
Feb
+0.42%
Mar
+1.36%
Apr
+0.13%
May
+0.79%
Jun
+1.67%
Jul
+0.70%
Aug
-1.11%
Sep
+0.55%
Oct
+1.01%
Nov
+1.27%
Dec
MONTHLY STATISTICS

S&P 500 Returns by Month

Positive frequency, negative frequency and historical return characteristics for each calendar month.

MonthObservationsPositiveNegativeFlatPositive %Negative %AverageMedian
January996237062.63%37.37%+1.21%+1.55%
February995148051.52%48.48%-0.11%+0.20%
March996039060.61%39.39%+0.42%+1.00%
April996534065.66%34.34%+1.36%+0.94%
May996039060.61%39.39%+0.13%+1.07%
June995643056.57%43.43%+0.79%+0.30%
July996039060.61%39.39%+1.67%+1.62%
August995841058.59%41.41%+0.70%+0.88%
September994454144.44%54.55%-1.11%-0.45%
October985840059.18%40.82%+0.55%+1.03%
November986137062.24%37.76%+1.01%+1.63%
December987127072.45%27.55%+1.27%+1.48%
MONTHLY RETURN HISTORY

S&P 500 Monthly Returns by Year

Calendar-month price returns across the complete available history.

YearJanFebMarAprMayJunJulAugSepOctNovDec
2026+1.4%-0.9%-5.1%+10.4%+5.1%-1.1%-0.1%+2.6%-0.5%+1.6%——
2025+2.7%-1.4%-5.8%-0.8%+6.2%+5.0%+2.2%+1.9%+3.5%+2.3%+0.1%-0.1%
2024+1.6%+5.2%+3.1%-4.2%+4.8%+3.5%+1.1%+2.3%+2.0%-1.0%+5.7%-2.5%
2023+6.2%-2.6%+3.5%+1.5%+0.2%+6.5%+3.1%-1.8%-4.9%-2.2%+8.9%+4.4%
2022-5.3%-3.1%+3.6%-8.8%+0.0%-8.4%+9.1%-4.2%-9.3%+8.0%+5.4%-5.9%
2021-1.1%+2.6%+4.2%+5.2%+0.5%+2.2%+2.3%+2.9%-4.8%+6.9%-0.8%+4.4%
2020-0.2%-8.4%-12.5%+12.7%+4.5%+1.8%+5.5%+7.0%-3.9%-2.8%+10.8%+3.7%
2019+7.9%+3.0%+1.8%+3.9%-6.6%+6.9%+1.3%-1.8%+1.7%+2.0%+3.4%+2.9%
2018+5.6%-3.9%-2.7%+0.3%+2.2%+0.5%+3.6%+3.0%+0.4%-6.9%+1.8%-9.2%
2017+1.8%+3.7%-0.0%+0.9%+1.2%+0.5%+1.9%+0.1%+1.9%+2.2%+2.8%+1.0%
2016-5.1%-0.4%+6.6%+0.3%+1.5%+0.1%+3.6%-0.1%-0.1%-1.9%+3.4%+1.8%
2015-3.1%+5.5%-1.7%+0.9%+1.0%-2.1%+2.0%-6.3%-2.6%+8.3%+0.1%-1.8%
2014-3.6%+4.3%+0.7%+0.6%+2.1%+1.9%-1.5%+3.8%-1.6%+2.3%+2.5%-0.4%
2013+5.0%+1.1%+3.6%+1.8%+2.1%-1.5%+4.9%-3.1%+3.0%+4.5%+2.8%+2.4%
2012+4.4%+4.1%+3.1%-0.7%-6.3%+4.0%+1.3%+2.0%+2.4%-2.0%+0.3%+0.7%
2011+2.3%+3.2%-0.1%+2.8%-1.4%-1.8%-2.1%-5.7%-7.2%+10.8%-0.5%+0.9%
2010-3.7%+2.9%+5.9%+1.5%-8.2%-5.4%+6.9%-4.7%+8.8%+3.7%-0.2%+6.5%
2009-8.6%-11.0%+8.5%+9.4%+5.3%+0.0%+7.4%+3.4%+3.6%-2.0%+5.7%+1.8%
2008-6.1%-3.5%-0.6%+4.8%+1.1%-8.6%-1.0%+1.2%-9.1%-16.9%-7.5%+0.8%
2007+1.4%-2.2%+1.0%+4.3%+3.3%-1.8%-3.2%+1.3%+3.6%+1.5%-4.4%-0.9%
2006+2.5%+0.0%+1.1%+1.2%-3.1%+0.0%+0.5%+2.1%+2.5%+3.2%+1.6%+1.3%
2005-2.5%+1.9%-1.9%-2.0%+3.0%-0.0%+3.6%-1.1%+0.7%-1.8%+3.5%-0.1%
2004+1.7%+1.2%-1.6%-1.7%+1.2%+1.8%-3.4%+0.2%+0.9%+1.4%+3.9%+3.2%
2003-2.7%-1.7%+0.8%+8.1%+5.1%+1.1%+1.6%+1.8%-1.2%+5.5%+0.7%+5.1%
2002-1.6%-2.1%+3.7%-6.1%-0.9%-7.2%-7.9%+0.5%-11.0%+8.6%+5.7%-6.0%
2001+3.5%-9.2%-6.4%+7.7%+0.5%-2.5%-1.1%-6.4%-8.2%+1.8%+7.5%+0.8%
2000-5.1%-2.0%+9.7%-3.1%-2.2%+2.4%-1.6%+6.1%-5.3%-0.5%-8.0%+0.4%
1999+4.1%-3.2%+3.9%+3.8%-2.5%+5.4%-3.2%-0.6%-2.9%+6.3%+1.9%+5.8%
1998+1.0%+7.0%+5.0%+0.9%-1.9%+3.9%-1.2%-14.6%+6.2%+8.0%+5.9%+5.6%
1997+6.1%+0.6%-4.3%+5.8%+5.9%+4.3%+7.8%-5.7%+5.3%-3.4%+4.5%+1.6%
1996+3.3%+0.7%+0.8%+1.3%+2.3%+0.2%-4.6%+1.9%+5.4%+2.6%+7.3%-2.2%
1995+2.4%+3.6%+2.7%+2.8%+3.6%+2.1%+3.2%-0.0%+4.0%-0.5%+4.1%+1.7%
1994+3.3%-3.0%-4.6%+1.2%+1.2%-2.7%+3.1%+3.8%-2.7%+2.1%-4.0%+1.2%
1993+0.7%+1.0%+1.9%-2.5%+2.3%+0.1%-0.5%+3.4%-1.0%+1.9%-1.3%+1.0%
1992-2.0%+1.0%-2.2%+2.8%+0.1%-1.7%+3.9%-2.4%+0.9%+0.2%+3.0%+1.0%
1991+4.2%+6.7%+2.2%+0.0%+3.9%-4.8%+4.5%+2.0%-1.9%+1.2%-4.4%+11.2%
1990-6.9%+0.9%+2.4%-2.7%+9.2%-0.9%-0.5%-9.4%-5.1%-0.7%+6.0%+2.5%
1989+7.1%-2.9%+2.1%+5.0%+3.5%-0.8%+8.8%+1.6%-0.7%-2.5%+1.7%+2.1%
1988+4.0%+4.2%-3.3%+0.9%+0.3%+4.3%-0.5%-3.9%+4.0%+2.6%-1.9%+1.5%
1987+13.2%+3.7%+2.6%-1.1%+0.6%+4.8%+4.8%+3.5%-2.4%-21.8%-8.5%+7.3%
1986+0.2%+7.1%+5.3%-1.4%+5.0%+1.4%-5.9%+7.1%-8.5%+5.5%+2.1%-2.8%
1985+7.4%+0.9%-0.3%-0.5%+5.4%+1.2%-0.5%-1.2%-3.5%+4.3%+6.5%+4.5%
1984-0.9%-3.9%+1.3%+0.5%-5.9%+1.7%-1.6%+10.6%-0.3%-0.0%-1.5%+2.2%
1983+3.3%+1.9%+3.3%+7.5%-1.2%+3.2%-3.0%+1.1%+1.0%-1.5%+1.7%-0.9%
1982-1.8%-6.1%-1.0%+4.0%-3.9%-2.0%-2.3%+11.6%+0.8%+11.0%+3.6%+1.5%
1981-4.6%+1.3%+3.6%-2.3%-0.2%-1.0%-0.2%-6.2%-5.4%+4.9%+3.7%-3.0%
1980+5.8%-0.4%-10.2%+4.1%+4.7%+2.7%+6.5%+0.6%+2.5%+1.6%+10.2%-3.4%
1979+4.0%-3.7%+5.5%+0.2%-2.6%+3.9%+0.9%+5.3%+0.0%-6.9%+4.3%+1.7%
1978-6.2%-2.5%+2.5%+8.5%+0.4%-1.8%+5.4%+2.6%-0.7%-9.2%+1.7%+1.5%
1977-5.1%-2.2%-1.4%+0.0%-2.4%+4.5%-1.6%-2.1%-0.2%-4.3%+2.7%+0.3%
1976+11.8%-1.1%+3.1%-1.1%-1.4%+4.1%-0.8%-0.5%+2.3%-2.2%-0.8%+5.2%
1975+12.3%+6.0%+2.2%+4.7%+4.4%+4.4%-6.8%-2.1%-3.5%+6.2%+2.5%-1.2%
1974-1.0%-0.4%-2.3%-3.9%-3.4%-1.5%-7.8%-9.0%-11.9%+16.3%-5.3%-2.0%
1973-1.7%-3.7%-0.1%-4.1%-1.9%-0.7%+3.8%-3.7%+4.0%-0.1%-11.4%+1.7%
1972+1.8%+2.5%+0.6%+0.4%+1.7%-2.2%+0.2%+3.4%-0.5%+0.9%+4.6%+1.2%
1971+4.0%+0.9%+3.7%+3.6%-4.2%-0.9%-3.2%+3.6%-0.7%-4.2%-0.3%+8.6%
1970-7.6%+5.3%+0.1%-9.0%-6.1%-5.0%+7.3%+4.4%+3.4%-1.2%+4.7%+5.7%
1969-0.8%-4.7%+3.4%+2.1%-0.2%-5.6%-6.0%+4.0%-2.5%+4.3%-3.4%-1.9%
1968-4.4%-3.1%+0.9%+8.0%+1.3%+0.9%-1.8%+1.1%+3.9%+0.7%+4.8%-4.2%
1967+7.8%+0.2%+3.9%+4.2%-5.2%+1.8%+4.5%-1.2%+3.3%-3.5%+0.8%+2.6%
1966+0.5%-1.8%-2.2%+2.1%-5.4%-1.6%-1.3%-7.8%-0.7%+4.8%+0.3%-0.1%
1965+3.3%-0.1%-1.5%+3.4%-0.8%-4.9%+1.3%+2.3%+3.2%+2.7%-0.9%+0.9%
1964+2.7%+1.0%+1.5%+0.6%+1.1%+1.6%+1.8%-1.6%+2.9%+0.8%-0.5%+0.4%
1963+4.9%-2.9%+3.5%+4.9%+1.4%-2.0%-0.3%+4.9%-1.1%+3.2%-1.1%+2.4%
1962-3.8%+1.6%-0.6%-6.2%-8.6%-8.2%+6.4%+1.5%-4.8%+0.4%+10.2%+1.3%
1961+6.3%+2.7%+2.6%+0.4%+1.9%-2.9%+3.3%+2.0%-2.0%+2.8%+3.9%+0.3%
1960-7.1%+0.9%-1.4%-1.8%+2.7%+2.0%-2.5%+2.6%-6.0%-0.2%+4.0%+4.6%
1959+0.4%-0.1%+0.1%+3.9%+1.9%-0.4%+3.5%-1.5%-4.6%+1.1%+1.3%+2.8%
1958+4.3%-2.1%+3.1%+3.2%+1.5%+2.6%+4.3%+1.2%+4.8%+2.5%+2.2%+5.2%
1957-4.2%-3.3%+2.0%+3.7%+3.7%-0.1%+1.1%-5.6%-6.2%-3.2%+1.6%-4.1%
1956-3.6%+3.5%+6.9%-0.2%-6.6%+3.9%+5.2%-3.8%-4.5%+0.5%-1.1%+3.5%
1955+1.8%+0.4%-0.5%+3.8%-0.1%+8.2%+6.1%-0.8%+1.1%-3.0%+7.5%-0.1%
1954+5.1%+0.3%+3.0%+4.9%+3.3%+0.1%+5.7%-3.4%+8.3%-1.9%+8.1%+5.1%
1953-0.7%-1.8%-2.4%-2.6%-0.3%-1.6%+2.5%-5.8%+0.1%+5.1%+0.9%+0.2%
1952+1.6%-3.6%+4.8%-4.3%+2.3%+4.6%+1.8%-1.5%-2.0%-0.1%+4.6%+3.5%
1951+6.0%+0.6%-1.5%+4.4%-4.1%-2.6%+6.9%+3.9%-0.1%-1.4%-0.3%+3.9%
1950+1.5%+1.0%+0.4%+3.9%+4.6%-5.8%+0.8%+3.3%+5.6%+0.4%-0.1%+4.7%
1949+0.1%-3.9%+3.0%-2.3%-3.5%-0.2%+6.2%+1.2%+2.4%+3.0%+0.1%+4.5%
1948-4.1%-5.1%+8.3%+2.7%+7.8%+0.3%-5.3%+0.8%-3.0%+6.5%-10.6%+3.1%
1947+2.4%-1.5%-1.7%-3.9%-0.9%+5.3%+3.6%-2.8%-1.4%+2.1%-2.9%+2.1%
1946+7.0%-6.9%+4.4%+4.0%+2.2%-3.9%-2.6%-7.3%-10.2%-0.8%-1.1%+4.2%
1945+1.4%+6.2%-4.8%+9.0%+1.1%-0.9%-1.4%+5.8%+3.5%+3.7%+3.2%+1.0%
1944+1.5%-0.3%+1.7%-1.2%+4.0%+5.1%-2.1%+0.9%-0.6%+0.3%+0.4%+3.5%
1943+6.9%+5.1%+5.6%+0.1%+4.0%+2.5%-4.0%-0.4%+2.4%-1.4%-7.5%+5.9%
1942+1.8%-2.9%-6.8%-4.4%+6.4%+1.8%+3.1%+0.7%+2.7%+5.8%-0.7%+5.2%
1941-4.8%-1.5%+0.4%-6.5%+0.8%+5.0%+5.5%-1.1%-0.8%-6.9%-4.0%-4.7%
1940-3.3%+0.7%+0.4%+0.1%-24.0%+7.7%+3.1%+2.0%+1.5%+3.9%-4.6%+0.1%
1939-6.4%+3.3%-13.5%-0.5%+6.1%-6.4%+10.9%-7.1%+14.4%+0.3%-4.9%+2.1%
1938+1.3%+6.1%-25.0%+15.1%-5.2%+24.7%+6.7%-2.2%+1.5%+7.6%-3.3%+3.2%
1937+3.4%+1.6%-0.8%-8.3%-1.0%-5.3%+8.9%-4.4%-14.2%-10.2%-10.0%-5.0%
1936+6.6%+2.0%+2.2%-7.7%+4.6%+3.1%+6.8%+0.9%+0.1%+7.6%+0.3%-0.6%
1935-4.2%-4.0%-3.3%+9.8%+3.2%+6.9%+8.2%+1.4%+3.1%+7.5%+3.9%+3.8%
1934+12.0%-3.7%-1.3%-1.5%-8.1%+2.1%-11.5%+5.4%-0.8%-3.0%+8.3%-0.4%
1933+0.3%-18.4%+3.4%+33.8%+23.1%+13.2%-8.8%+11.5%-12.4%-7.8%+10.3%+0.9%
1932-2.2%+4.4%-11.8%-20.2%-23.3%-0.9%+36.1%+39.1%-3.7%-13.9%-5.9%+5.6%
1931+5.5%+11.4%-7.4%-9.6%-13.7%+13.9%-7.4%+0.9%-29.9%+7.4%-8.9%-14.5%
1930+6.2%+2.2%+3.7%+3.1%-1.6%-16.5%+3.7%+0.8%-13.0%-8.9%-3.3%-6.3%
1929+5.7%-0.6%-0.2%+1.6%-4.3%+10.4%+5.4%+9.8%-4.9%-19.9%-13.4%+2.5%
1928-0.5%-1.8%+11.7%+2.4%+1.3%-4.3%+1.5%+7.4%+1.3%+2.6%+12.0%+0.3%
METHODOLOGY

How Monthly Returns Are Calculated

Monthly price return is calculated using the final trading-day closing price of each calendar month relative to the final trading-day closing price of the previous month. Dividends are excluded.

Historical month statistics use completed calendar months only. An incomplete current month is shown separately as month-to-date and does not affect the historical frequency calculations.

Source: Yahoo Finance — S&P 500 Index (^GSPC)
1,185 completed month observations represented across the January–December statistics.

S&P 500 Monthly Returns, History and Performance

Explore S&P 500 returns and stock market returns from 1928 to the present. This historical S&P 500 chart and data set shows S&P 500 history by month and year, including the S&P 500 average return for each calendar month, monthly stock market returns, positive and negative return frequency, SPX performance, and current month-to-date performance. The interactive S&P 500 chart and research tools make it possible to compare long-term market behavior across decades and identify how monthly performance has changed through different market cycles.

The historical data also provides detailed SPX monthly data for studying seasonality, the best and worst months for the S&P 500, average monthly return percentages, and long-term stock market returns and performance history. Investors researching SPY historical data or index fund returns can use S&P 500 index history as related benchmark research, although the calculations on this page represent the S&P 500 index itself rather than SPY ETF returns. Annual performance is available separately in TNI's S&P 500 annual returns research.