Nasdaq AI Stock Crash 2026 vs. the 2000 Dot-Com Bubble
On November 5, 2026, the Nasdaq Composite fell 1,421.51 points (5.52%), its largest one-day point drop in our daily closing-price data going back to December 1996. What could come next for AI stocks? To put the selloff in context, we compare today’s AI boom with the dot-com bubble, from the 1998 correction through the 2000 peak and the decline that followed. Where do the two booms look similar, and where do their paths diverge?
Nasdaq points lost in one trading session
The largest nominal one-day point loss in the downloaded Nasdaq series, which begins in December 1996. This is not the largest daily percentage decline.
Two technology booms. Two different market cycles.
The Nasdaq rallied during the internet revolution, suffered a sharp correction in 1998, then surged into March 2000. Its subsequent collapse demonstrated that transformative technology and attractive stock-market returns are not the same thing.
The AI boom beginning in 2023 shares the themes of infrastructure investment, earnings expectations and concentrated technology leadership. But similarities do not establish that 2026 will repeat the dot-com crash.
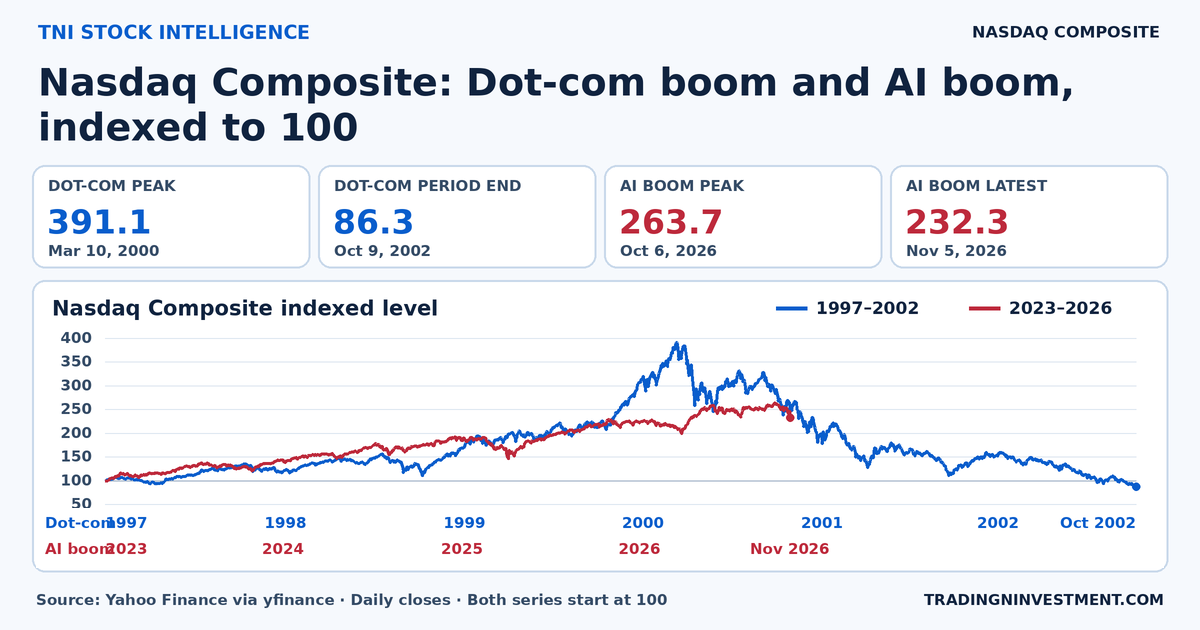
| Period | Peak level (date) | Ending level (date) |
|---|---|---|
| Dot-com, 1997–2002 | 391.1 (2000-03-10) | 86.3 (2002-10-09) |
| AI boom, 2023–2026 | 263.7 (2026-10-06) | 232.3 (2026-11-05) |
The 1998 crash came before the dot-com peak
The Nasdaq lost roughly 30% during the 1998 market shock, then climbed to its March 2000 high. An initial deep correction did not end the technology boom.
After March 2000, the collapse developed over approximately 31 months. Strong interim rallies occurred before the October 2002 trough, illustrating why a rebound alone cannot establish that a bear market has ended.
10 AI and semiconductor stocks: 2026 peak drawdowns
The index-level selloff conceals much deeper declines in individual technology companies. Each figure below is calculated from the highest daily closing price during the preceding 12 months through November 5.
Source: Yahoo Finance daily Close, downloaded through November 5, 2026. TNI calculations. This is a selected group, not a ranking of Nasdaq index contributions.
The 10 largest Nasdaq companies at the 2000 peak
The dot-com collapse was not limited to unprofitable internet startups. Microsoft, Cisco, Intel, Oracle and other established technology leaders suffered major stock-price declines.
Historical published figures, rounded to whole percentages. Source: Reuters' March 2000 Nasdaq company ranking and Los Angeles Times, March 6, 2001. These are first-year losses, not full 2000–2002 maximum drawdowns.
The internet eventually became essential economic infrastructure. But that did not prevent enormous valuation losses among its leading suppliers. The same distinction between economic success and investment returns matters when analyzing AI.
Nasdaq's 10 worst single-day percentage declines
Calculated from consecutive Nasdaq Composite daily closes, December 1996–November 5, 2026. Not an all-time ranking back to 1971.
Nasdaq's 10 largest daily point losses
Ranking is by index points lost, while bar length shows the corresponding percentage loss for meaningful cross-era comparison. Source: Yahoo Finance daily Nasdaq closing levels.
How deep could a further Nasdaq correction become?
The following figures are mathematical stress scenarios calculated from the actual 2026 Nasdaq closing peak. They are not price forecasts or probabilities.
Levels calculated directly from the maximum 2026 Nasdaq closing price in the imported daily series.
What would confirm a deeper AI bear market?
The crucial evidence is not simply whether technology prices fall. Investors should watch revisions to AI infrastructure spending, semiconductor earnings expectations, free cash flow, market breadth and the sustainability of recoveries.
AI can generate lasting economic value while some equity investments deliver disappointing returns. The dot-com era provides compelling historical evidence of that distinction, not a mechanical forecast for 2026.
The technology can be right while the investment price is wrong. Compare valuations, earnings and drawdowns rather than assuming that a historical crash must repeat.