The Nasdaq Fell 13.48%. How Does Today’s AI Sell-Off Compare With the Dot-Com Crash?
The Nasdaq has entered correction territory, and investors are questioning whether AI infrastructure spending can earn adequate returns. The sell-off raises a bubble question; it does not answer it.
Index data through November 19, 2026 close. Stock prices are intraday snapshots from November 20, 2026 at 10:06 a.m. ET.
How the Nasdaq traded through two technology booms
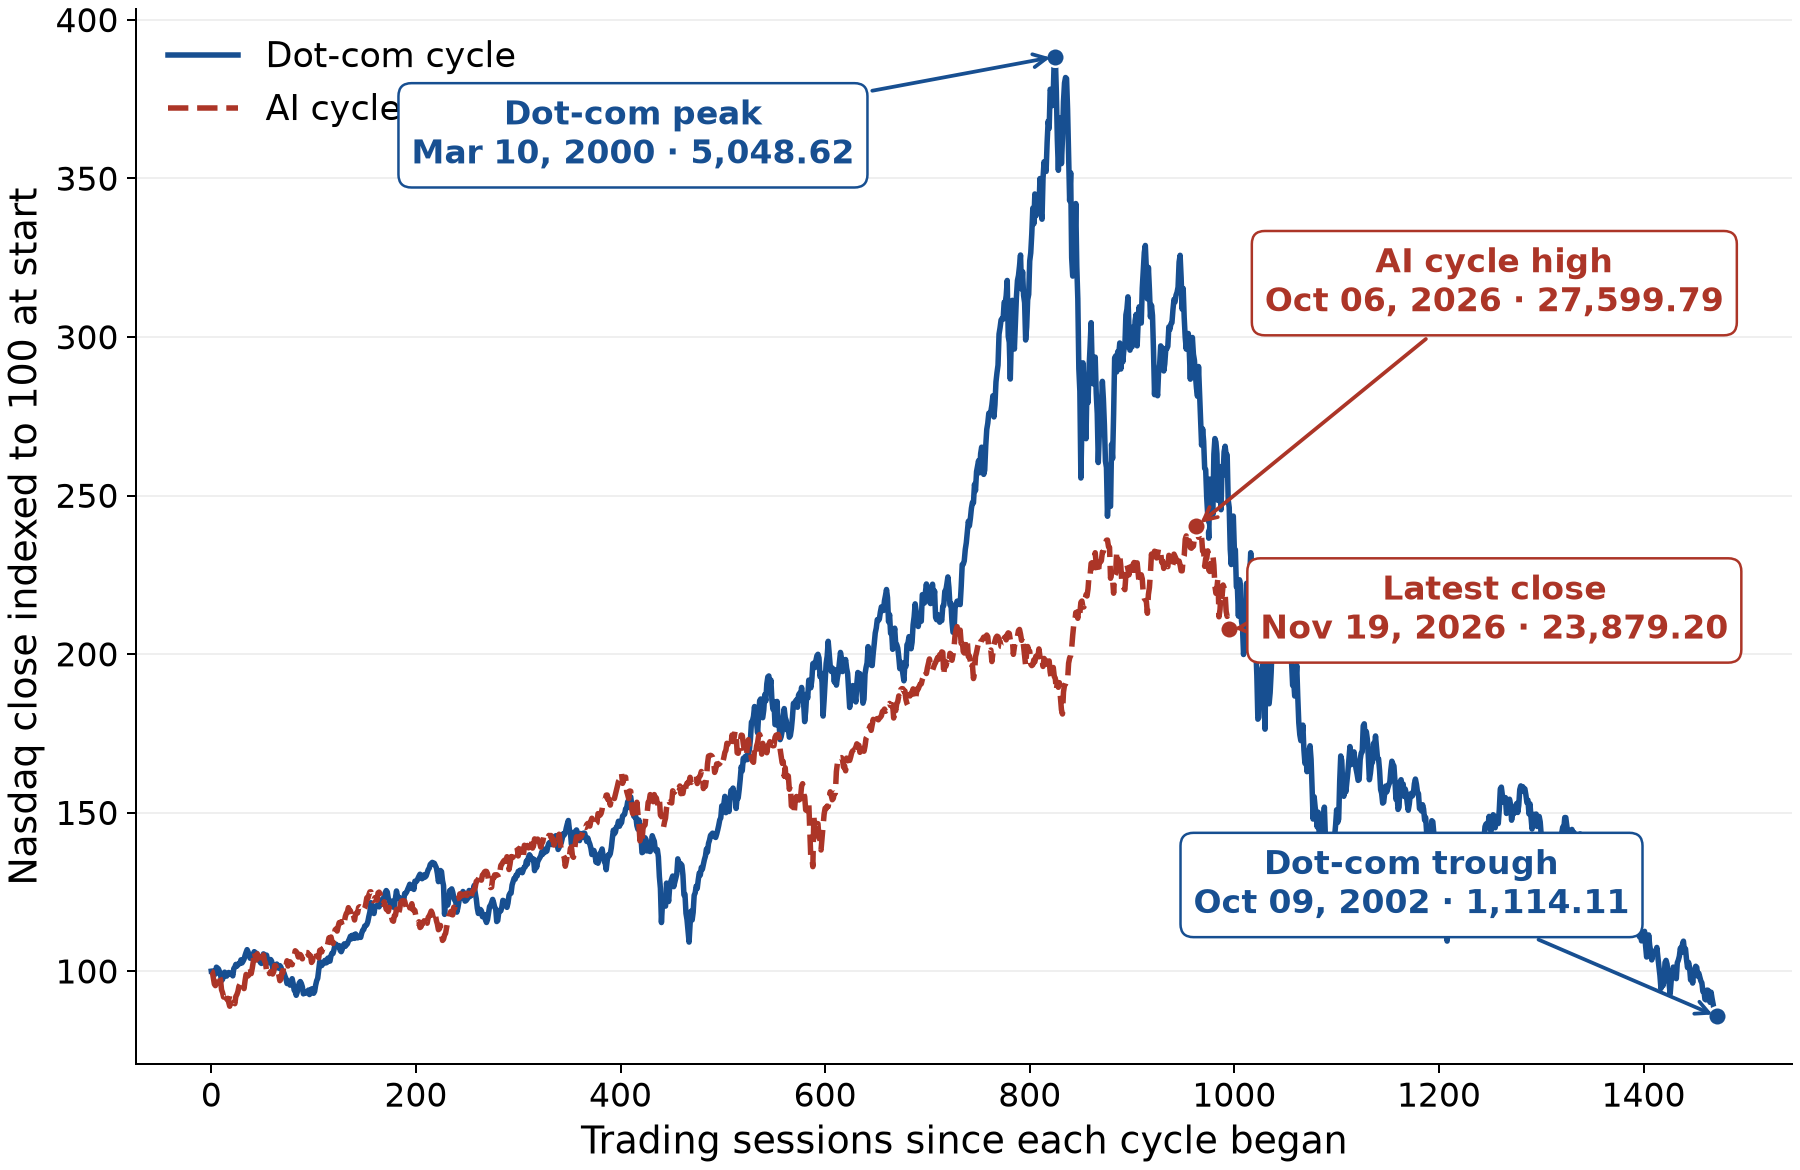
AI cycle: By November 19, 2026, the Nasdaq was 13.48% below its October 6 closing high.
Dots mark each peak and final observation. Source: Yahoo Finance daily Nasdaq Composite closes.
Watch the Nasdaq bear market analysis
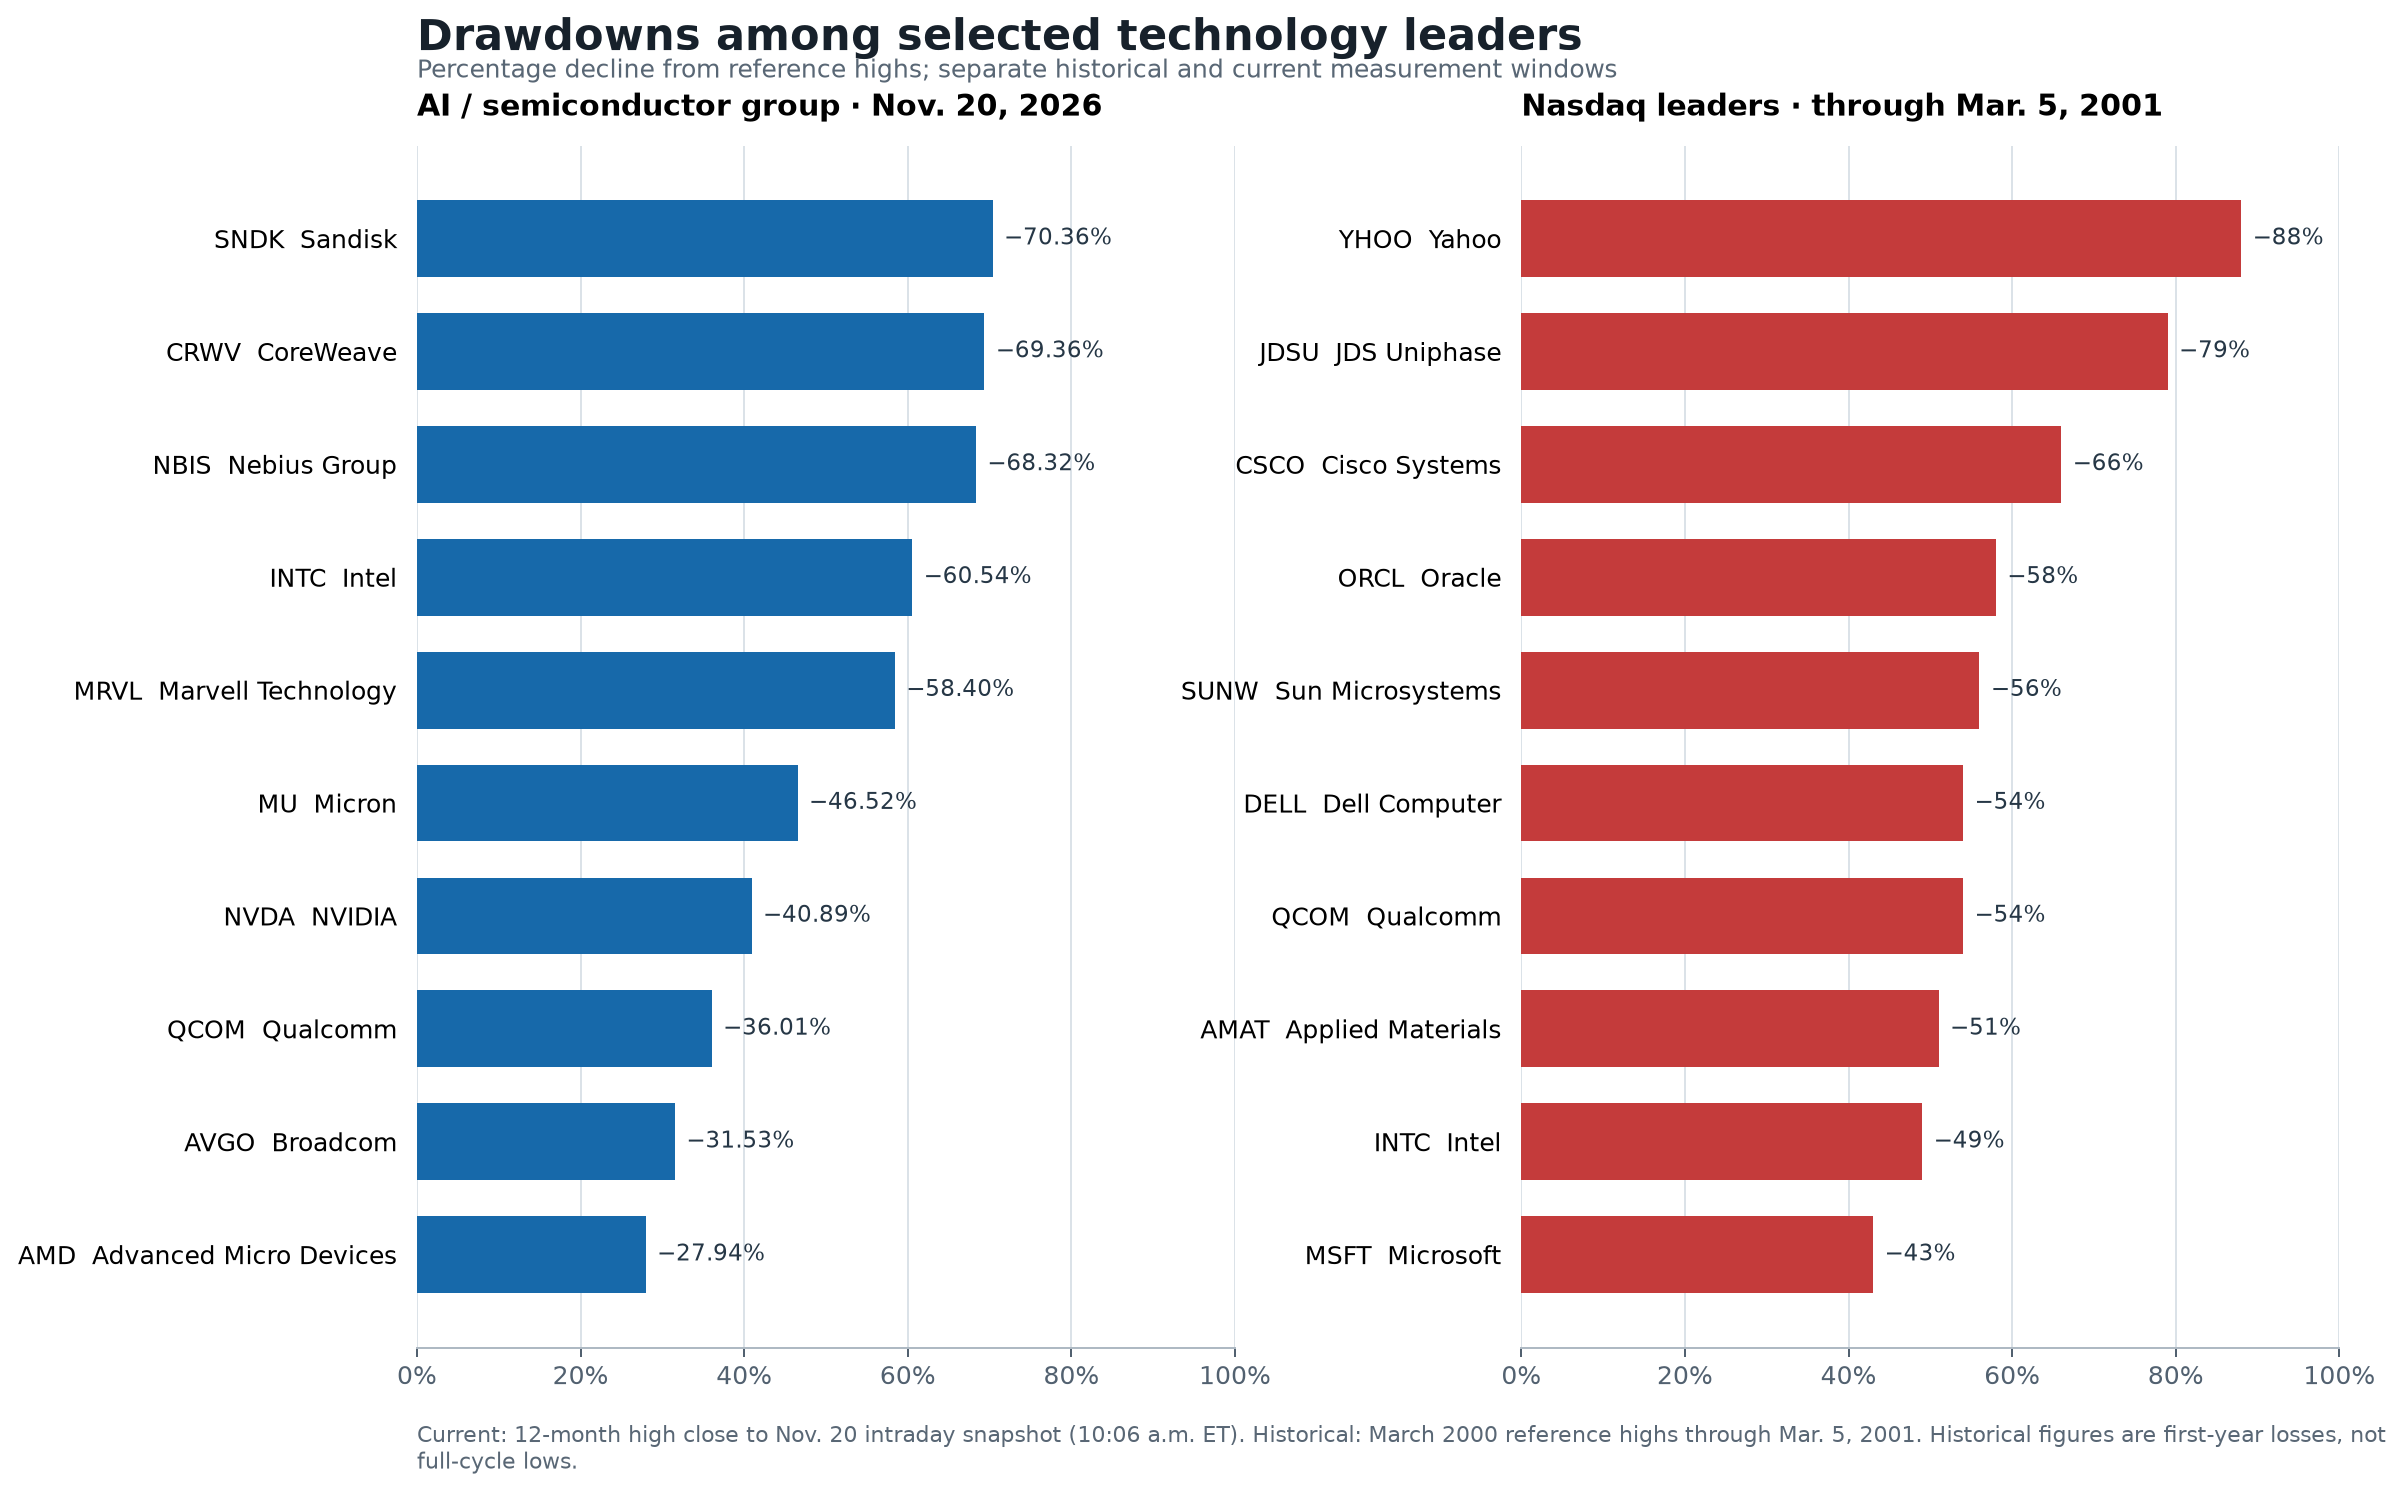
Top decliners: 2000 leaders vs. AI-era stocks now
The same percentage scale makes the drawdown sizes easy to compare, while the different measurement windows remain explicit.
The Nasdaq Composite closed at 23,879.20 on November 19, down 13.48% from its October 6 record close of 27,599.79. The index fell 2.25% on November 19 alone. A decline above 10% is commonly called a correction; the label describes the size of the fall, not its cause or what happens next.
Why the AI sell-off has revived the bubble question
Investors are reassessing whether the revenue and productivity gains from artificial intelligence will justify the cost of building data centers, buying accelerators and expanding power capacity. Recent reporting has identified high valuations and heavy spending as concerns weighing on AI shares.
The pressure is occurring alongside strong company results. NVIDIA reported fiscal third-quarter revenue of $115.8 billion, up 103% from a year earlier. Data Center revenue was $107.6 billion, up 110%. Those figures show that demand is producing substantial revenue for a leading supplier; they do not yet settle the return earned by every customer investing in AI.
LPL Research estimated that four major hyperscalers were guiding toward roughly $730 billion of capital spending in 2026, about 78% above the roughly $410 billion spent in 2025. That is broad company capital expenditure, not an audited tally of AI-only investment.
The test is whether customer revenue, productivity and free cash flow rise fast enough to support that buildout. If investment keeps growing while monetization, utilization or returns disappoint, investors may lower the multiples they are willing to pay. If revenue and cash flow keep pace, heavy spending may be more sustainable than the sell-off suggests.
Ten AI and semiconductor stocks: peak prices and today’s snapshot
The table updates the ten stocks from TNI’s prior drawdown chart. Drawdowns compare each stock’s highest daily closing price in the prior 12 months through November 13 with its November 20 intraday price snapshot. These are price drawdowns, not forecasts.
| Ticker | Company | Peak close 2026 | Nov. 20 price 10:06 a.m. ET | From peak |
|---|---|---|---|---|
| SNDK | Sandisk | $291.88¹ | $86.52 | −70.36% |
| CRWV | CoreWeave | $137.98 | $42.28 | −69.36% |
| NBIS | Nebius Group | $286.69 | $90.82 | −68.32% |
| INTC | Intel | $140.94 | $55.62 | −60.54% |
| MRVL | Marvell Technology | $316.43 | $131.62 | −58.40% |
| MU | Micron Technology | $1,213.56 | $649.04 | −46.52% |
| NVDA | NVIDIA | $239.24 | $141.41 | −40.89% |
| QCOM | Qualcomm | $251.02 | $160.62 | −36.01% |
| AVGO | Broadcom | $481.57 | $329.74 | −31.53% |
| AMD | Advanced Micro Devices | $649.42 | $467.95 | −27.94% |
¹ Sandisk completed an 8-for-1 forward split effective after the November 19 close. The former $2,335.00 peak is shown as $291.88 on a split-adjusted basis so it can be compared with the November 20 share price. Price snapshots are intraday and can change.
What the 2000 technology leaders lost
The dot-com collapse hit established technology companies as well as speculative internet firms. The following selected leaders were among the ten largest Nasdaq companies at the March 2000 peak. Their declines run from their March 2000 reference peaks through March 5, 2001; they are first-year losses, not each stock’s maximum drawdown through 2002.
| Historical ticker | Company at the time | Decline through Mar. 5, 2001 |
|---|---|---|
| YHOO | Yahoo | −88% |
| JDSU | JDS Uniphase | −79% |
| CSCO | Cisco Systems | −66% |
| ORCL | Oracle | −58% |
| SUNW | Sun Microsystems | −56% |
| DELL | Dell Computer | −54% |
| QCOM | Qualcomm | −54% |
| AMAT | Applied Materials | −51% |
| INTC | Intel | −49% |
| MSFT | Microsoft | −43% |
Historical figures are rounded. They are not full-cycle 2000–02 drawdowns. Source: TNI’s previous Nasdaq crash research, based on the cited historical reports.
What would confirm a deeper AI bear market?
One sharp decline cannot establish that today’s market is a bubble. More useful evidence will arrive in company results: whether cloud and AI revenue growth keeps pace with capital spending, whether customers report measurable returns, and whether free cash flow remains resilient as infrastructure costs rise.
Investors can also watch earnings revisions, backlog conversion, data-center utilization, financing needs and market breadth. A broadening decline accompanied by weaker estimates would suggest more than a valuation reset in a few crowded trades. Improving cash generation and sustained demand would challenge the bearish case.
The technology can be right while the price is wrong
The dot-com era remains relevant because a technology can transform the economy while many stocks tied to it still deliver poor returns from an inflated entry price. The comparison is a risk framework, not a forecast that the Nasdaq must repeat its 2000–02 path.
As of November 19, the Nasdaq was 13.48% below its record close. Nvidia’s sales show that AI demand is real, while the scale of planned spending makes the return-on-investment question harder to ignore. The bubble thesis will depend on whether revenue and cash flows catch up with expectations—not on the sell-off alone.
Methodology: Index drawdowns use Nasdaq Composite closing levels. The dot-com decline runs from the March 10, 2000 close to the October 9, 2002 close. The current drawdown runs from the October 6, 2026 closing record to the November 19 close. Stock peak closes and peak dates are from the preceding TNI chart; current prices are November 20 intraday snapshots at 10:06 a.m. ET. All figures are price-only and exclude dividends.
- Federal Reserve Bank of St. Louis: downloaded Nasdaq Composite daily closes (NASDAQCOM)
- Associated Press: November 19, 2026 market close
- NVIDIA: fiscal Q3 2027 results
- LPL Research: October 2026 rate and credit view
- Sandisk SEC filing: 8-for-1 stock split
- Charles Schwab: market correction terminology
- TNI’s original dot-com vs. AI-era Nasdaq tracking chart and historical stock data