NASDAQ COMPOSITE RESEARCH

Nasdaq Composite Monthly Returns

Historical Nasdaq Composite monthly price returns from 1972 to present, including seasonal patterns, positive and negative month frequency, and current-month performance.

Research & Analysis by • Quantitative Researcher • TradingNInvestment

Kamal Khondkar is a quantitative researcher focused on systematic trading, derivatives, and applied AI. He brings more than a decade of financial-market experience and holds an M.S. in Finance from the University of Rochester’s Simon Business School.

Share this research
CURRENT MONTH

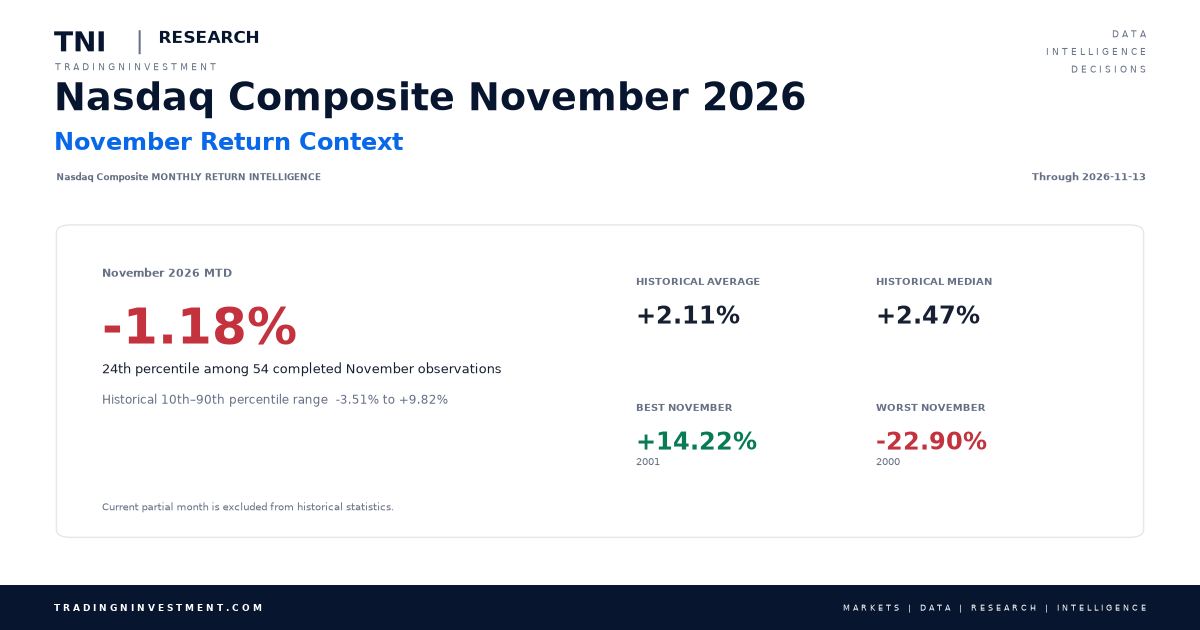
November 2026 MTD

Through 2026-11-13

-1.18%
Historical November Average+2.11%
Historically Positive72.22%
Historically Negative27.78%
Historical Observations54
RETURN CONTEXT

November vs History

Current month through 2026-11-13

-1.18%
Historical Median+2.47%
Historical Percentile24.1th
Best November+14.22%2001
Worst November-22.90%2000
Typical Historical Range-3.51% to +9.82%10th–90th percentile · 54 completed November observations
RISK CONTEXT

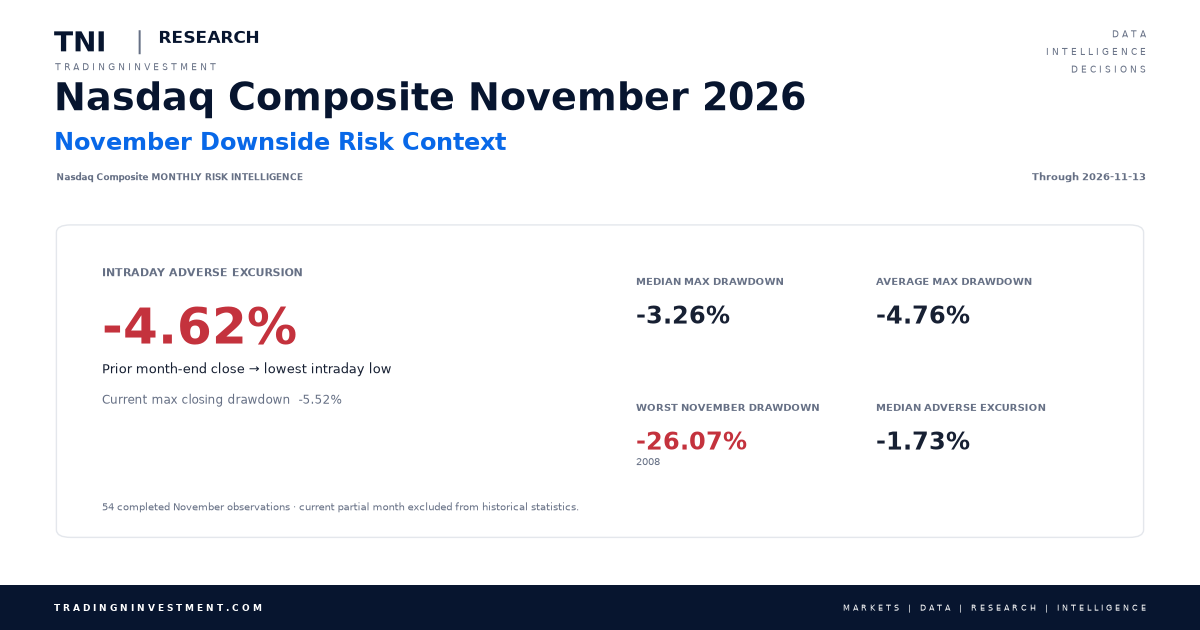
November Downside Risk

Current month through 2026-11-13

-4.62%
Max Closing Drawdown-5.52%
Intraday Adverse Excursion-4.62%
Historical Median Drawdown-3.26%
Historical Average Drawdown-4.76%
Worst Historical November Drawdown-26.07%2008 · 54 completed November observations

27.78% of completed historical November observations had an equal or more severe closing-price drawdown. The current month is incomplete.

HISTORICAL MONTHLY PATTERNS

Which Months Have Historically Been Strongest and Weakest?

Frequency and average-return statistics use completed calendar months only. The current partial month is excluded.

MOST CONSISTENTLY POSITIVE

November

72.22%

Positive historical months

MOST CONSISTENTLY NEGATIVE

February

49.09%

Negative historical months

HIGHEST AVERAGE RETURN

January

+2.47%

Historical monthly average

LOWEST AVERAGE RETURN

September

-0.74%

Historical monthly average

MONTH-BY-MONTH PERFORMANCE

Average Return by Calendar Month

Historical average price return for each calendar month.

+2.47%
Jan
+0.40%
Feb
+0.49%
Mar
+1.50%
Apr
+1.47%
May
+1.05%
Jun
+0.91%
Jul
+0.36%
Aug
-0.74%
Sep
+0.74%
Oct
+2.11%
Nov
+1.34%
Dec
MONTHLY STATISTICS

Nasdaq Composite Returns by Month

Positive frequency, negative frequency and historical return characteristics for each calendar month.

MonthObservationsPositiveNegativeFlatPositive %Negative %AverageMedian
January553718067.27%32.73%+2.47%+2.86%
February552827050.91%49.09%+0.40%+0.10%
March553421061.82%38.18%+0.49%+1.20%
April553619065.45%34.55%+1.50%+1.56%
May553520063.64%36.36%+1.47%+3.11%
June553223058.18%41.82%+1.05%+1.32%
July553223058.18%41.82%+0.91%+1.16%
August553124056.36%43.64%+0.36%+1.54%
September552926052.73%47.27%-0.74%+0.25%
October553025054.55%45.45%+0.74%+2.16%
November543915072.22%27.78%+2.11%+2.47%
December543222059.26%40.74%+1.34%+0.53%
MONTHLY RETURN HISTORY

Nasdaq Composite Monthly Returns by Year

Calendar-month price returns across the complete available history.

YearJanFebMarAprMayJunJulAugSepOctNovDec
2026+0.9%-3.4%-4.8%+15.3%+8.4%-2.8%-3.2%+3.9%+1.9%-5.3%-1.2%—
2025+1.6%-4.0%-8.2%+0.8%+9.6%+6.6%+3.7%+1.6%+5.6%+4.7%-1.5%-0.5%
2024+1.0%+6.1%+1.8%-4.4%+6.9%+6.0%-0.8%+0.6%+2.7%-0.5%+6.2%+0.5%
2023+10.7%-1.1%+6.7%+0.0%+5.8%+6.6%+4.0%-2.2%-5.8%-2.8%+10.7%+5.5%
2022-9.0%-3.4%+3.4%-13.3%-2.1%-8.7%+12.3%-4.6%-10.5%+3.9%+4.4%-8.7%
2021+1.4%+0.9%+0.4%+5.4%-1.5%+5.5%+1.2%+4.0%-5.3%+7.3%+0.3%+0.7%
2020+2.0%-6.4%-10.1%+15.4%+6.8%+6.0%+6.8%+9.6%-5.2%-2.3%+11.8%+5.7%
2019+9.7%+3.4%+2.6%+4.7%-7.9%+7.4%+2.1%-2.6%+0.5%+3.7%+4.5%+3.5%
2018+7.4%-1.9%-2.9%+0.0%+5.3%+0.9%+2.2%+5.7%-0.8%-9.2%+0.3%-9.5%
2017+4.3%+3.8%+1.5%+2.3%+2.5%-0.9%+3.4%+1.3%+1.0%+3.6%+2.2%+0.4%
2016-7.9%-1.2%+6.8%-1.9%+3.6%-2.1%+6.6%+1.0%+1.9%-2.3%+2.6%+1.1%
2015-2.1%+7.1%-1.3%+0.8%+2.6%-1.6%+2.8%-6.9%-3.3%+9.4%+1.1%-2.0%
2014-1.7%+5.0%-2.5%-2.0%+3.1%+3.9%-0.9%+4.8%-1.9%+3.1%+3.5%-1.2%
2013+4.1%+0.6%+3.4%+1.9%+3.8%-1.5%+6.6%-1.0%+5.1%+3.9%+3.6%+2.9%
2012+8.0%+5.4%+4.2%-1.5%-7.2%+3.8%+0.2%+4.3%+1.6%-4.5%+1.1%+0.3%
2011+1.8%+3.0%-0.0%+3.3%-1.3%-2.2%-0.6%-6.4%-6.4%+11.1%-2.4%-0.6%
2010-5.4%+4.2%+7.1%+2.6%-8.3%-6.5%+6.9%-6.2%+12.0%+5.9%-0.4%+6.2%
2009-6.4%-6.7%+10.9%+12.3%+3.3%+3.4%+7.8%+1.5%+5.6%-3.6%+4.9%+5.8%
2008-9.9%-5.0%+0.3%+5.9%+4.6%-9.1%+1.4%+1.8%-11.6%-17.7%-10.8%+2.7%
2007+2.0%-1.9%+0.2%+4.3%+3.1%-0.0%-2.2%+2.0%+4.0%+5.8%-6.9%-0.3%
2006+4.6%-1.1%+2.6%-0.7%-6.2%-0.3%-3.7%+4.4%+3.4%+4.8%+2.7%-0.7%
2005-5.2%-0.5%-2.6%-3.9%+7.6%-0.5%+6.2%-1.5%-0.0%-1.5%+5.3%-1.2%
2004+3.1%-1.8%-1.8%-3.7%+3.5%+3.1%-7.8%-2.6%+3.2%+4.1%+6.2%+3.8%
2003-1.1%+1.3%+0.3%+9.2%+9.0%+1.7%+6.9%+4.3%-1.3%+8.1%+1.5%+2.2%
2002-0.8%-10.5%+6.6%-8.5%-4.3%-9.4%-9.2%-1.0%-10.9%+13.5%+11.2%-9.7%
2001+12.2%-22.4%-14.5%+15.0%-0.3%+2.4%-6.2%-10.9%-17.0%+12.8%+14.2%+1.0%
2000-3.2%+19.2%-2.6%-15.6%-11.9%+16.6%-5.0%+11.7%-12.7%-8.3%-22.9%-4.9%
1999+14.3%-8.7%+7.6%+3.3%-2.8%+8.7%-1.8%+3.8%+0.2%+8.0%+12.5%+22.0%
1998+3.1%+9.3%+3.7%+1.8%-4.8%+6.5%-1.2%-19.9%+13.0%+4.6%+10.1%+12.5%
1997+6.9%-5.1%-6.7%+3.2%+11.1%+3.0%+10.5%-0.4%+6.2%-5.5%+0.4%-1.9%
1996+0.7%+3.8%+0.1%+8.1%+4.4%-4.7%-8.8%+5.6%+7.5%-0.4%+5.8%-0.1%
1995+0.4%+5.1%+3.0%+3.3%+2.4%+8.0%+7.3%+1.9%+2.3%-0.7%+2.2%-0.7%
1994+3.0%-1.0%-6.2%-1.3%+0.2%-4.0%+2.3%+6.0%-0.2%+1.7%-3.5%+0.2%
1993+2.9%-3.7%+2.9%-4.2%+5.9%+0.5%+0.1%+5.4%+2.7%+2.2%-3.2%+3.0%
1992+5.8%+2.1%-4.7%-4.2%+1.1%-3.7%+3.1%-3.0%+3.6%+3.8%+7.9%+3.7%
1991+10.8%+9.4%+6.4%+0.5%+4.4%-6.0%+5.5%+4.7%+0.2%+3.1%-3.5%+11.9%
1990-8.6%+2.4%+2.3%-3.5%+9.3%+0.7%-5.2%-13.0%-9.6%-4.3%+8.9%+4.1%
1989+5.2%-0.4%+1.8%+5.1%+4.3%-2.4%+4.2%+3.4%+0.8%-3.7%+0.1%-0.3%
1988+4.3%+6.5%+2.1%+1.2%-2.3%+6.6%-1.9%-2.8%+2.9%-1.3%-2.9%+2.7%
1987+12.4%+8.4%+1.2%-2.9%-0.3%+2.0%+2.4%+4.6%-2.4%-27.2%-5.6%+8.3%
1986+3.4%+7.1%+4.2%+2.3%+4.4%+1.3%-8.4%+3.1%-8.4%+2.9%-0.3%-3.0%
1985+12.8%+2.0%-1.8%+0.5%+3.6%+1.9%+1.7%-1.2%-5.8%+4.4%+7.4%+3.5%
1984-3.7%-5.9%-0.7%-1.3%-5.9%+2.9%-4.2%+10.9%-1.8%-1.2%-1.9%+1.9%
1983+6.9%+5.0%+3.9%+8.2%+5.3%+3.2%-4.6%-3.8%+1.4%-7.4%+4.1%-2.5%
1982-3.8%-4.8%-2.1%+5.2%-3.3%-4.1%-2.3%+6.2%+5.6%+13.3%+9.3%+0.0%
1981-2.2%+0.1%+6.1%+3.1%+3.1%-3.5%-1.9%-7.5%-8.0%+8.4%+3.1%-2.7%
1980+7.0%-2.3%-17.1%+6.9%+7.5%+4.9%+8.9%+5.7%+3.4%+2.7%+8.0%-2.8%
1979+6.6%-2.6%+7.5%+1.6%-1.8%+5.1%+2.3%+6.4%-0.3%-9.6%+6.4%+4.8%
1978-4.0%+0.6%+4.7%+8.5%+4.4%+0.0%+5.0%+6.9%-1.6%-16.4%+3.2%+2.9%
1977-2.4%-1.0%-0.5%+1.4%+0.1%+4.3%+0.9%-0.5%+0.7%-3.3%+5.8%+1.8%
1976+12.1%+3.7%+0.4%-0.6%-2.3%+2.6%+1.1%-1.7%+1.7%-1.0%+0.9%+7.4%
1975+16.6%+4.6%+3.6%+3.8%+5.8%+4.7%-4.4%-5.0%-5.9%+3.6%+2.4%-1.5%
1974+3.0%-0.6%-2.2%-5.9%-7.7%-5.3%-7.9%-10.9%-10.7%+17.2%-3.5%-5.0%
1973-4.0%-6.2%-2.5%-8.2%-4.8%-1.6%+7.6%-3.5%+6.0%-0.9%-15.1%-1.4%
1972+4.2%+5.5%+2.2%+2.5%+0.9%-1.8%-1.8%+1.7%-0.3%+0.5%+2.1%+0.6%
METHODOLOGY

How Monthly Returns Are Calculated

Monthly price return is calculated using the final trading-day closing price of each calendar month relative to the final trading-day closing price of the previous month. Dividends are excluded.

Historical month statistics use completed calendar months only. An incomplete current month is shown separately as month-to-date and does not affect the historical frequency calculations.

Source: Yahoo Finance — Nasdaq Composite (^IXIC)
658 completed month observations represented across the January–December statistics.