Research Library Original research and historical data
Stock Market Today ⌄
OverviewNews Agent
Heatmap + Scanner ⌄S&P 500
Sector HealthEarnings Calendar
ETF Scanner · Public ⌄Leveraged ETF Scanner
🔒 Stock Scanners · Sign in ⌄S&P 500 ScannerSign-in required ↗Russell 3000 ScannerSign-in required ↗
Trading ⌄
OverviewTrading StrategiesPrediction Lab ↗Candlestick PatternsTrading ResearchTrading Tools
Brokerage ⌄
All brokerage categoriesRegular BrokerageOptions Trading BrokerageFunded Accounts
Launch TNI→
Menu ⌄
Home
Stock Market Today ⌄
OverviewNews Agent
Heatmap + Scanner ⌄S&P 500
Sector HealthEarnings Calendar
ETF Scanner · Public ⌄Leveraged ETF Scanner
🔒 Stock Scanners · Sign in ⌄S&P 500 ScannerSign-in required ↗Russell 3000 ScannerSign-in required ↗
Research ⌄
Research Library
Trading ⌄
OverviewTrading StrategiesPrediction Lab ↗Candlestick PatternsTrading ResearchTrading Tools
Brokerage ⌄
All brokerage categoriesRegular BrokerageOptions Trading BrokerageFunded Accounts
AboutLaunch TNI ↗
Research/Market History/Market History: Risk & Drawdowns
Research collection

Market History: Risk & Drawdowns

Declines, volatility, recovery, and the path through uncertainty.
⌕
3 published studies
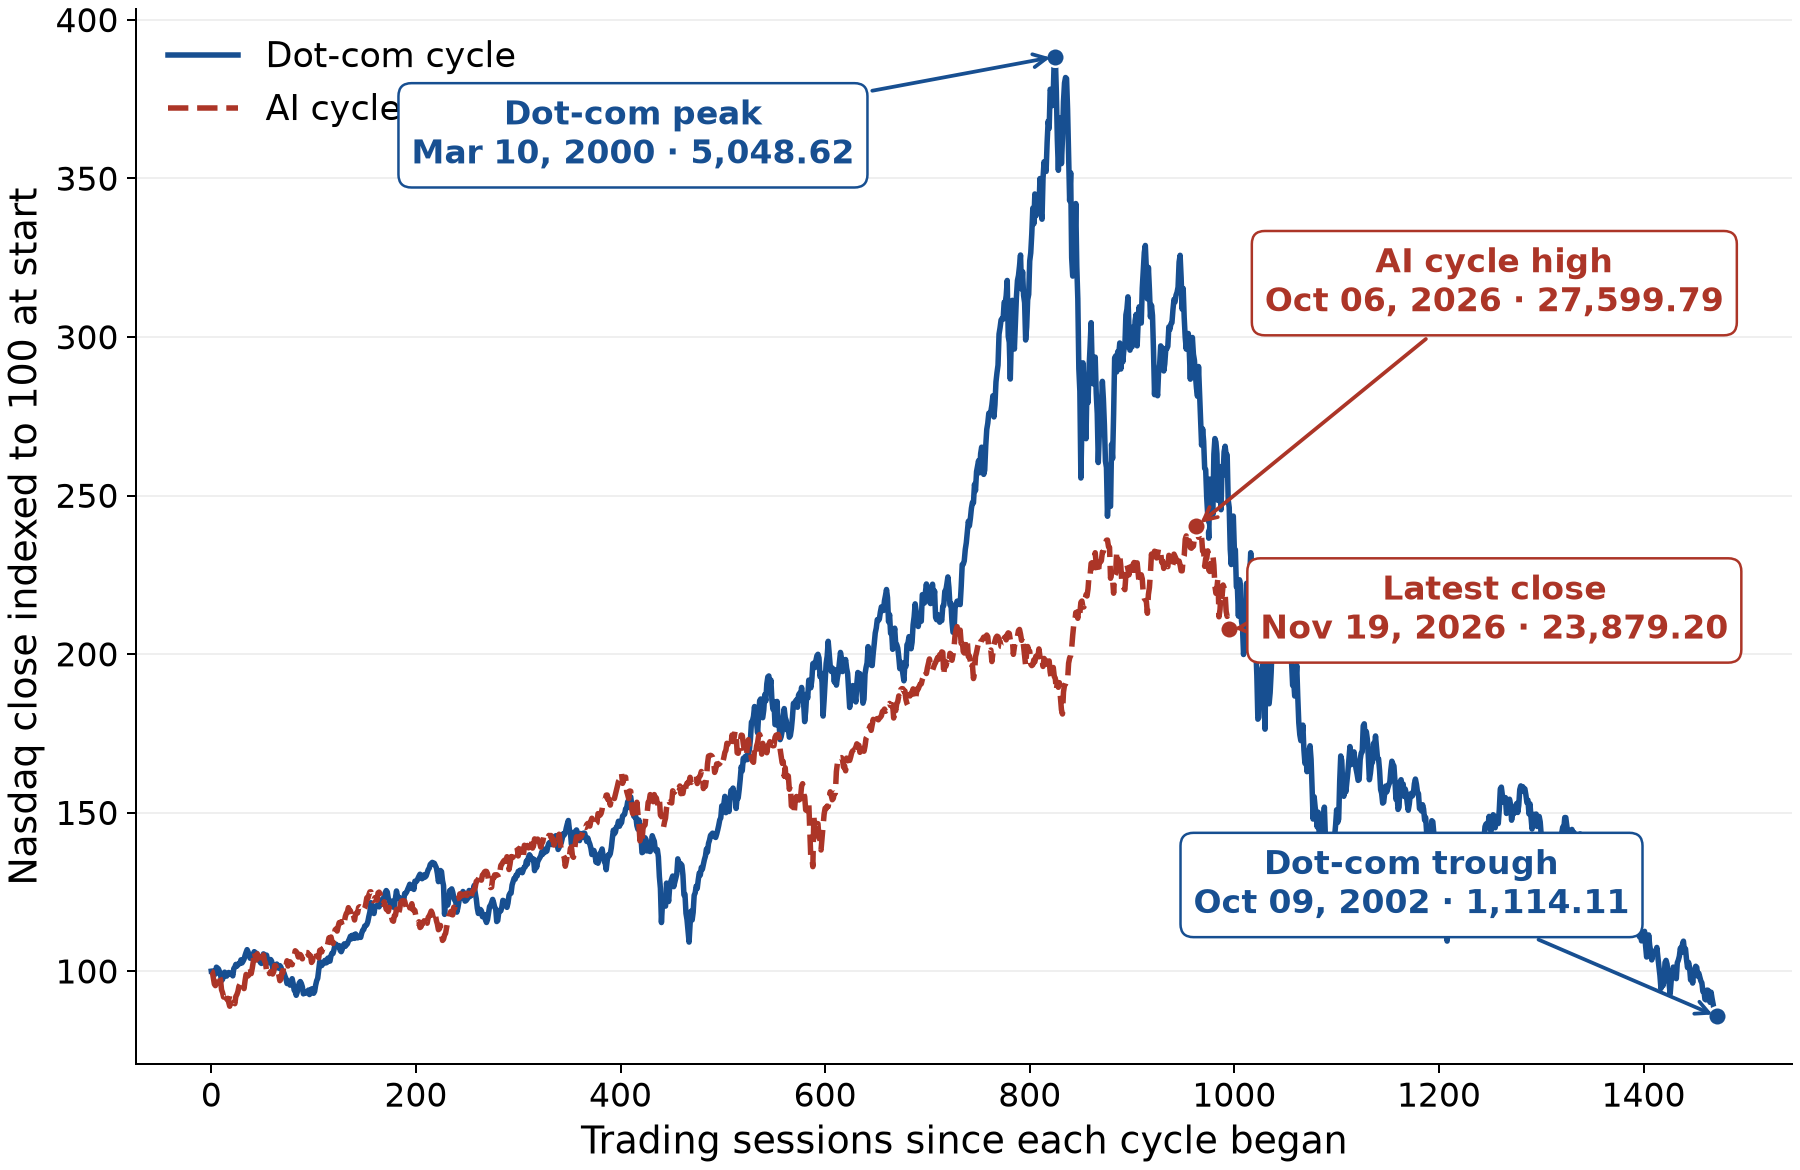
The Nasdaq Fell 13.48%. How Does Today’s AI Sell-Off Compare With the Dot-Com Crash?
Risk & Drawdowns

The Nasdaq Fell 13.48%. How Does Today’s AI Sell-Off Compare With the Dot-Com Crash?

The Nasdaq fell 13.48% from its October high. Compare 10 AI and semiconductor stocks with 10 dot-com leaders and track both Nasdaq cycles on one chart.
Explore study ↗
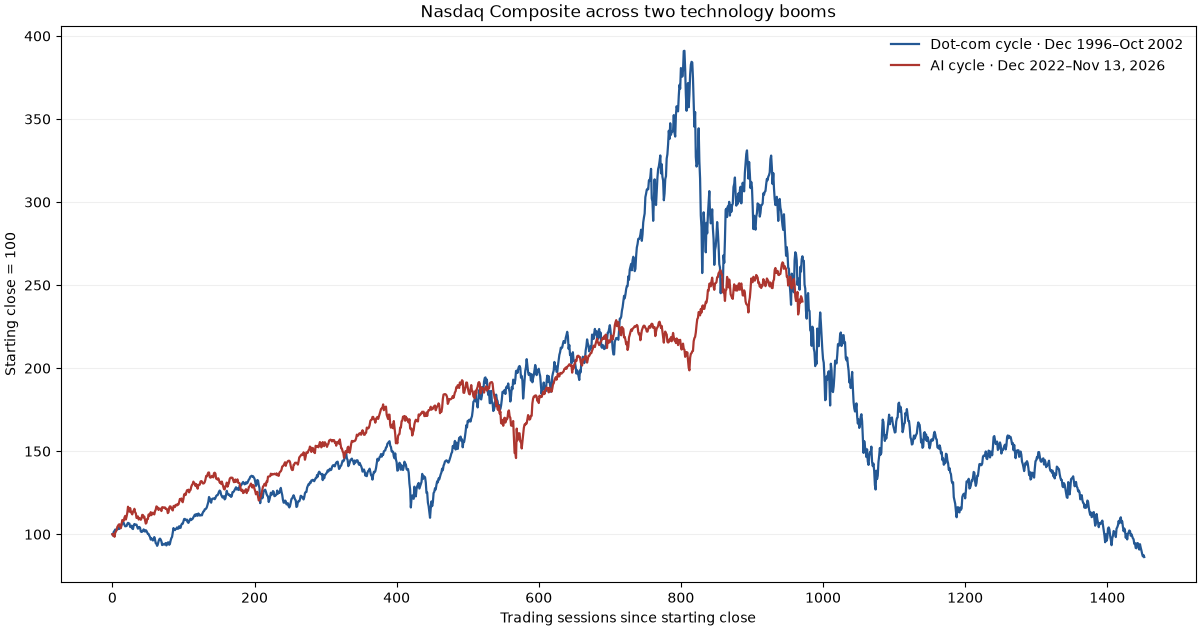
Nasdaq AI Stock Crash 2026 vs. the 2000 Dot-Com Bubble
Risk & Drawdowns

Nasdaq AI Stock Crash 2026 vs. the 2000 Dot-Com Bubble

Original research comparing the Nasdaq AI selloff with the dot-com crash, major technology-stock drawdowns and historical forward returns after severe market declines.
Explore study ↗
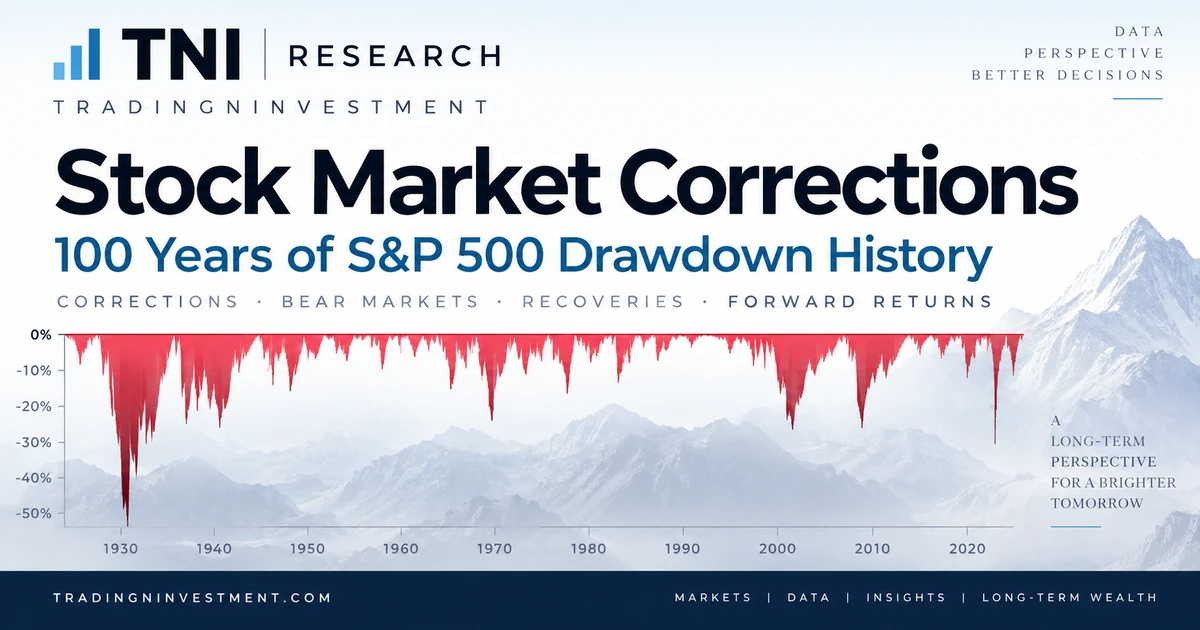
Stock Market Corrections: 100 Years of S&P 500 Drawdown History
Risk & Drawdowns

Stock Market Corrections: 100 Years of S&P 500 Drawdown History

Explore nearly 100 years of S&P 500 stock market corrections, bear markets, drawdowns and recoveries using daily historical closing-price data.

Explore study ↗
← Back to Research
Educational & Research Purposes Only

All content, data, charts, research, analysis, and tools provided by TradingNInvestment (TNI) are for educational and research purposes only and do not constitute investment, financial, trading, legal, or tax advice. Information may contain errors, omissions, or delays. Users should independently verify information, conduct their own due diligence, and consult qualified professionals where appropriate before making investment or commercial decisions. Past performance does not guarantee future results.

TNI
TradingNInvestmentResearch. Data. Intelligence.
ResearchLaunch TNI
© 2026 TradingNInvestment (TNI). All rights reserved. · Research & Data LicenseResearch and information. Not investment advice.