TNIRESEARCH
tradingninvestment.comDATA · INTELLIGENCE · DECISIONS
SOXL STOCK LEVERAGED ETF INTELLIGENCE
SOXL ETF: Performance, Holdings & Historical Returns
Explore Direxion Daily Semiconductor Bull 3X Shares returns by year from 2011 to present. Analyze the current-year return, 1-year, 3-year, 5-year and 10-year returns, average historical returns, positive and negative market years, and long-term market performance using the interactive research explorer.
Research & Analysis by Kamal Khondkar • Quant Researcher • TradingNInvestment
Direxion Daily Semiconductor Bull 3X Shares Historical Return Statistics
Historical Direxion Daily Semiconductor Bull 3X Shares annual price-return statistics from 2011 to present, with the current year reported separately as year-to-date.
Historical Coverage
2011 to Present
Latest verified market data
Average Annual Return
+66.68%
Completed calendar years
Median Annual Return
+69.74%
Completed calendar years
Positive / Non-Negative Years
10
66.67% of completed years
Negative Years
5
33.33% of completed years
Best Year
+229.84%
2019
Worst Year
-85.78%
2022
Current Year Return
+289.51%
2026 YTD · YTD
Direxion Daily Semiconductor Bull 3X Shares 1-Year, 3-Year, 5-Year and 10-Year Returns
Period returns are compounded from the latest completed calendar-year Direxion Daily Semiconductor Bull 3X Shares price returns. Multi-year cards also show the annualized return for the same completed-year period.
1-Year Return
+53.90%
2025 completed calendar year
3-Year Return
+63.20%
2023–2025 • Annualized
5-Year Return
+6.21%
2021–2025 • Annualized
10-Year Return
+37.15%
2016–2025 • Annualized
SOXL Research Context
What This SOXL Analysis Examines
SOXL is a 3× long ETF with a daily investment objective. Because the objective resets daily, returns over a week, month, year, or longer period should not be assumed to equal the stated leverage multiple applied to the corresponding long-term return of SMH.
Daily compounding, market volatility, financing costs, fund expenses, and the path of returns can materially affect the outcome.
This TNI research therefore examines SOXL across the historical periods supported by the available data. The analysis includes annual returns, drawdowns, and synchronized comparisons with SMH.
The objective is to show how SOXL has behaved across different market periods and holding horizons—not to imply that historical performance predicts future results.
Leveraged ETF results should be interpreted in the context of the fund's stated daily objective, underlying exposure, implementation structure, costs, and available operating history. TNI calculates its historical return comparisons independently from market-price data.
Growth of $10,000
See how a hypothetical $10,000 investment in SOXL grew over time.
2011–2025Long-term growth
RETURN BREAKDOWN15-Year Comparison
| Return Component | Ending Value | CAGR | Contribution |
|---|---|---|---|
| Price Return | $504,460 | 29.9% | 91.0% |
| Dividend + Reinvestment | +$49,908 | — | 9.0% |
| Total Return | $554,369 | 30.7% | 100.0% |
CONTRIBUTION THROUGH TIMEHow Reinvestment Compounded
| Year | Price Wealth | Total Wealth | Dividend + Reinvestment | Contribution |
|---|---|---|---|---|
| 2011 | $5,193 | $5,193 | +$0 | 0.0% |
| 2012 | $5,379 | $5,379 | +$0 | 0.0% |
| 2013 | $13,807 | $13,807 | +$0 | 0.0% |
| ···2023 | $376,875 | $408,089 | +$31,214 | 7.6% |
| 2024 | $327,785 | $357,864 | +$30,079 | 8.4% |
| 2025 | $504,460 | $554,369 | +$49,908 | 9.0% |
Contribution % represents the share of ending total-return wealth associated with the difference between the dividend-reinvested total-return path and the price-only path. It is not the historical dividend yield.
Publisher Embed Code
<iframe src="https://tradingninvestment.com/embed/soxl-etf/10000-growth/" width="100%" height="620" style="border:0;" loading="lazy" title="Growth of $10,000 Invested in SOXL — TradingNInvestment Research"></iframe>
Annual Returns
Direxion Daily Semiconductor Bull 3X Shares Annual Price Returns by Year
Performance
Time Period
Custom Range
From
→
To
Benchmark Comparison
Direxion Daily Semiconductor Bull 3X Shares vs. SMH Returns
Annual price-return comparison across overlapping completed calendar years from 2011 through 2025. Excess return is Direxion Daily Semiconductor Bull 3X Shares return minus SMH return.
Years Compared
15
Direxion Daily Semiconductor Bull 3X Shares Avg. Return
+66.68%
SMH Avg. Return
+26.71%
Avg. Excess Return
+39.97%
Outperformed
9 years
60.0% of comparable years
Underperformed
6 years
| Year | Direxion Daily Semiconductor Bull 3X Shares | SMH | Difference | Result |
|---|---|---|---|---|
| 2025 | +53.90% | +48.71% | +5.19% | Outperformed |
| 2024 | -13.03% | +38.49% | -51.51% | Underperformed |
| 2023 | +224.72% | +72.34% | +152.38% | Outperformed |
| 2022 | -85.78% | -34.28% | -51.50% | Underperformed |
| 2021 | +118.69% | +41.37% | +77.32% | Outperformed |
| 2020 | +69.74% | +54.46% | +15.28% | Outperformed |
| 2019 | +229.84% | +62.02% | +167.82% | Outperformed |
| 2018 | -39.58% | -10.77% | -28.81% | Underperformed |
| 2017 | +141.51% | +36.53% | +104.98% | Outperformed |
| 2016 | +113.30% | +34.46% | +78.84% | Outperformed |
Comparison uses calendar-year price returns over the common historical period. Current-year YTD performance is shown separately and is excluded from completed-year statistics.
Comparative Intelligence
SOXL vs. SMH
Rolling 10-Year Annualized Returns
Each point shows the annualized price return over the trailing 10 completed calendar years. Select a year to compare the long-term return for SOXL and SMH.
● SOXL● SMH
2025
37.15%SOXL2025
29.75%SMHExcess
+7.41%SOXL − SMHPrice-return comparison. Rolling results are calculated from annual calendar-year returns and exclude the current incomplete year. Hover or tap a year to inspect the values.
DRAWDOWN & RECOVERY
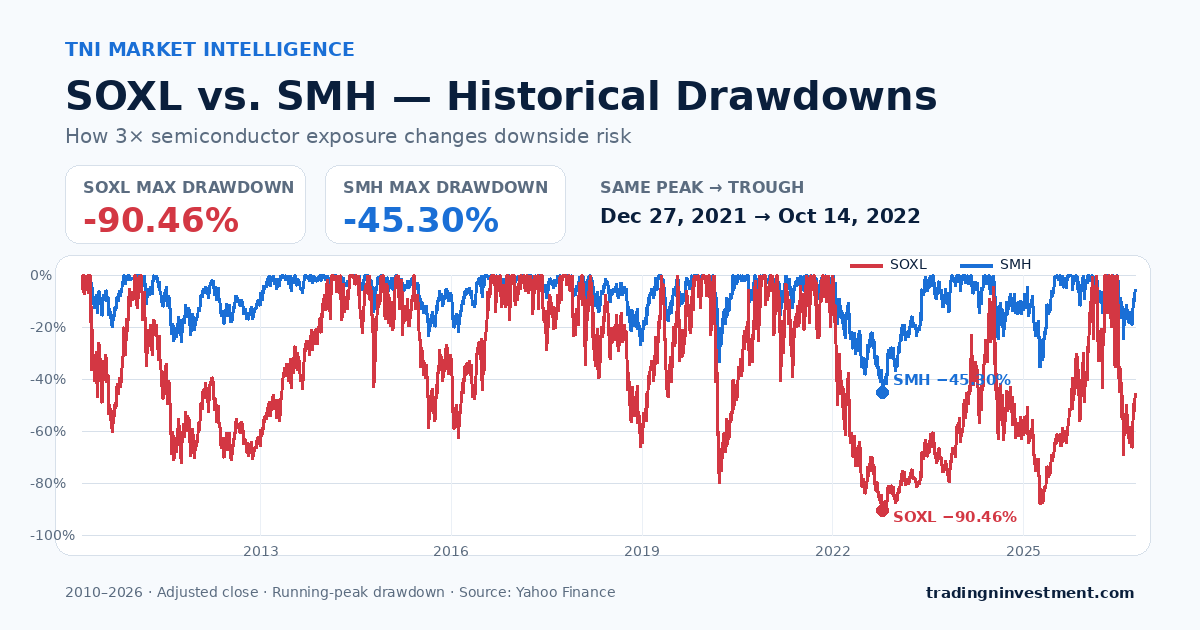
SOXL vs SMH Drawdowns
Drawdown measures the decline from a previous investment peak. For a daily leveraged ETF, drawdown helps show how leverage, volatility and compounding can change the depth of losses and the time required to recover.
How severe can a SOXL drawdown be?
In this synchronized SOXL–SMH dataset, SOXL's maximum adjusted-close drawdown was -90.46%, compared with -45.30% for SMH.
A hypothetical $10,000 investment made at SOXL's prior peak would have fallen to approximately $954 at the trough. Recovering from that loss requires a subsequent gain of approximately 948% just to return to the previous peak.
The same comparison for SMH would reduce $10,000 to approximately $5,470, requiring roughly 83% to recover. This illustrates why the magnitude of a percentage loss matters: the gain required to recover becomes increasingly large as drawdowns deepen.
For a different long-term equity perspective, see TNI's Berkshire Hathaway historical returns.
SOXL DRAWDOWN HISTORY
From peak to recovery
The timeline of SOXL's deepest historical decline.
TOTAL TIME BELOW PREVIOUS PEAK
1,521calendar days
Drawdown perspective
SOXL declined from its Dec 27, 2021 peak to its lowest point on Oct 14, 2022. It regained that previous high on Feb 25, 2026, completing a decline-and-recovery cycle of 1,521 calendar days.
Source: Yahoo Finance. Drawdowns are calculated from synchronized daily adjusted-close observations from 2010-03-11 through 2026-10-02. Each series is measured from its own running peak over the identical comparison period. Past performance does not guarantee future results.
Share This Research
Use the TradingNInvestment Direxion Daily Semiconductor Bull 3X Shares Returns Chart
Share the interactive chart, embed it in an article or website, download the annual-return data as CSV, or use the static research visualization subject to the usage terms below.
View Interactive EmbedDownload Direxion Daily Semiconductor Bull 3X Shares Annual Returns CSVDownload TNI Social Chart
Publisher Embed Code
<iframe src="https://tradingninvestment.com/embed/soxl-etf/" width="100%" height="620" style="border:0;" loading="lazy" title="Direxion Daily Semiconductor Bull 3X Shares Historical Returns — TradingNInvestment Research"></iframe>
Usage & Licensing
This TradingNInvestment research visualization and associated analysis are provided for personal, educational, and non-commercial research use with appropriate TradingNInvestment attribution.
Commercial reproduction, redistribution, resale, publication in commercial products or services, or removal of TradingNInvestment attribution requires prior permission.
For commercial licensing, publishing permissions, data partnerships, or other usage requests, Contact TradingNInvestment →
Underlying market data may be subject to separate third-party data-provider terms. TradingNInvestment permission applies to TradingNInvestment's original visualization, presentation, analysis, and associated research materials and does not grant rights to third-party data.
Direxion Daily Semiconductor Bull 3X Shares Annual Returns by Year: 2011 to Present
Showing 15 annual price-return observations for 2011–2025.
● Negative● 0% – <10%● ≥10%
| Year | SOXL Price Return | Return Category |
|---|---|---|
| 2025 | +53.90% | ≥10% |
| 2024 | -13.03% | Negative |
| 2023 | +224.72% | ≥10% |
| 2022 | -85.78% | Negative |
| 2021 | +118.69% | ≥10% |
| 2020 | +69.74% | ≥10% |
| 2019 | +229.84% | ≥10% |
| 2018 | -39.58% | Negative |
| 2017 | +141.51% | ≥10% |
| 2016 | +113.30% | ≥10% |
| 2015 | -20.58% | Negative |
| 2014 | +95.33% | ≥10% |
| 2013 | +156.68% | ≥10% |
| 2012 | +3.58% | 0% – <10% |
| 2011 | -48.07% | Negative |
The current year is reported as year-to-date (YTD). Historical figures shown on this page are Direxion Daily Semiconductor Bull 3X Shares price returns.
Interactive Direxion Daily Semiconductor Bull 3X Shares Return Statistics
Statistics below update with the selected filters. Average, median, best and worst annual returns use completed calendar years only, so the current YTD period does not distort historical annual statistics.
Average Annual Return
+66.68%
15 completed years
Median Annual Return
+69.74%
Completed years only
Positive Years
10
66.67% of completed years
Negative Years
5
33.33% of completed years
Best Year
+229.84%
2019
Worst Year
-85.78%
2022
Historical Coverage
2011 to Present
Return Type
SOXL Price Return
Data Source
Yahoo Finance — Direxion Daily Semiconductor Bull 3X Shares (SOXL)
Direxion Daily Semiconductor Bull 3X Shares Historical Returns: What the Available Market History Shows
The history of Direxion Daily Semiconductor Bull 3X Shares returns shows how annual performance has varied across the available historical record.
This Direxion Daily Semiconductor Bull 3X Shares yearly returns database contains 15 completed calendar years from 2011 through 2025, plus the current 2026 year-to-date observation.
Across those 15 completed years, the average annual Direxion Daily Semiconductor Bull 3X Shares price return was +66.68%.
The median annual return was +69.74%.
Those summary statistics are useful, but the complete Direxion Daily Semiconductor Bull 3X Shares annual-return history provides more detail about how yearly performance has varied across the available record.
Looking at individual annual observations makes it possible to compare yearly outcomes using the same verified historical dataset.
Positive Direxion Daily Semiconductor Bull 3X Shares Years: Average Return +120.73%
One of the strongest findings in the historical Direxion Daily Semiconductor Bull 3X Shares returns dataset is the frequency of non-negative calendar years.
Of the 15 completed calendar years, 10 were non-negative.
That represents 66.67% of all completed years in the historical dataset.
In other words, roughly two-thirds of the completed calendar-year observations finished at or above where they began.
Across those 10 non-negative years, the average annual Direxion Daily Semiconductor Bull 3X Shares price return was +120.73%.
The median return among those non-negative years was +115.99%.
That median is useful because it shows that the positive-year average was not driven solely by a small number of extraordinary market gains.
Strongest Positive Direxion Daily Semiconductor Bull 3X Shares Year
The strongest completed year in the entire dataset was 2019, when the Direxion Daily Semiconductor Bull 3X Shares price return reached +229.84%.
For this research, a zero return is included in the non-negative group.
Negative Direxion Daily Semiconductor Bull 3X Shares Years: Average Loss -41.41%
Negative years tell the other side of Direxion Daily Semiconductor Bull 3X Shares performance history.
Across the same 15 completed calendar years, 5 years were negative.
That represents 33.33% of completed years.
Looking only at those 5 negative years, the average annual Direxion Daily Semiconductor Bull 3X Shares price return was -41.41%.
The median negative-year return was -39.58%.
These figures show that a negative calendar year historically meant considerably more than simply finishing slightly below zero.
Worst Direxion Daily Semiconductor Bull 3X Shares Year
The worst calendar year in the dataset was 2022, when the Direxion Daily Semiconductor Bull 3X Sharesprice return fell -85.78%.
Negative calendar years occurred less frequently than non-negative calendar years, but several historical losses were substantial.
What Positive and Negative Direxion Daily Semiconductor Bull 3X Shares Returns Show Together
Putting both groups together reveals one of the most important characteristics of historical Direxion Daily Semiconductor Bull 3X Shares returns.
There were 10 non-negative completed years compared with 5 negative completed years.
The average return during the 10 non-negative years was +120.73%.
The average return during the 5 negative years was -41.41%.
Across all 15 completed years together, the average annual Direxion Daily Semiconductor Bull 3X Shares price return was +66.68%.
The median annual return across the full historical period was +69.74%.
An investor rarely experiences the long-term historical average in any particular calendar year.
Instead, individual Direxion Daily Semiconductor Bull 3X Shares annual returns can vary substantially around that average.
That is one reason the complete Direxion Daily Semiconductor Bull 3X Shares historical returns by year table can be more informative than relying on a single long-term number.
What Does the Direxion Daily Semiconductor Bull 3X Shares Average Return of +66.68% Mean?
Across the 15 completed calendar years in this dataset, the arithmetic Direxion Daily Semiconductor Bull 3X Shares average return was +66.68% per completed calendar year.
This is the arithmetic average of the individual annual price returns in the historical dataset.
It does not mean the market gained exactly 66.68% in a typical year.
Individual Direxion Daily Semiconductor Bull 3X Shares yearly returns frequently differed substantially from that number.
The median annual return of +69.74% provides a second way to evaluate the distribution.
Looking at both the average and median gives readers more information about historical Direxion Daily Semiconductor Bull 3X Shares returns than either statistic provides by itself.
These figures represent Direxion Daily Semiconductor Bull 3X Shares price returns, not total returns.
Direxion Daily Semiconductor Bull 3X Shares 3-Year Return View
The current Direxion Daily Semiconductor Bull 3X Shares 3-year return view covers 2024 through 2026 YTD.
Within that window, there are 2 completed calendar years.
The average annual price return across those completed years was +20.44%.
The median annual return was +20.44%.
1 of the 2 completed years were non-negative, representing 50.00% of completed observations.
1 completed year was negative, representing 50.00%.
The strongest completed year in the period was 2025 at +53.90%.
The weakest completed year was 2024 at -13.03%.
The current 2026 YTD return of +289.51% remains separate from those completed-year statistics.
3-Year Average Return Is Not the Same as 3-Year CAGR
The +20.44% figure is the arithmetic average of the completed annual price returns in this display window. It should not be described as a 3-year cumulative return or compound annual growth rate.
A true 3-year cumulative return or CAGR requires a different calculation.
This completed-year sample can be compared with the full 15-year historical record when interpreting recent-period results.
Direxion Daily Semiconductor Bull 3X Shares 5-Year Return View
The current Direxion Daily Semiconductor Bull 3X Shares 5-year return view covers 2022 through 2026 YTD.
Within that window, there are 4 completed calendar years.
The average annual price return across those completed years was +44.95%.
The median annual return was +20.44%.
2 of the 4 completed years were non-negative, representing 50.00% of completed observations.
2 completed years were negative, representing 50.00%.
The strongest completed year in the period was 2023 at +224.72%.
The weakest completed year was 2022 at -85.78%.
The current 2026 YTD return of +289.51% remains separate from those completed-year statistics.
5-Year Average Return Is Not the Same as 5-Year CAGR
The +44.95% figure is the arithmetic average of the completed annual price returns in this display window. It should not be described as a 5-year cumulative return or compound annual growth rate.
A true 5-year cumulative return or CAGR requires a different calculation.
This completed-year sample can be compared with the full 15-year historical record when interpreting recent-period results.
Direxion Daily Semiconductor Bull 3X Shares 10-Year Return View
The current Direxion Daily Semiconductor Bull 3X Shares 10-year return view covers 2017 through 2026 YTD.
Within that window, there are 9 completed calendar years.
The average annual price return across those completed years was +77.78%.
The median annual return was +69.74%.
6 of the 9 completed years were non-negative, representing 66.67% of completed observations.
3 completed years were negative, representing 33.33%.
The strongest completed year in the period was 2019 at +229.84%.
The weakest completed year was 2022 at -85.78%.
The current 2026 YTD return of +289.51% remains separate from those completed-year statistics.
10-Year Average Return Is Not the Same as 10-Year CAGR
The +77.78% figure is the arithmetic average of the completed annual price returns in this display window. It should not be described as a 10-year cumulative return or compound annual growth rate.
A true 10-year cumulative return or CAGR requires a different calculation.
This completed-year sample can be compared with the full 15-year historical record when interpreting recent-period results.
Best and Worst Direxion Daily Semiconductor Bull 3X Shares Annual Returns
The strongest calendar-year price return in the dataset occurred in 2019 at +229.84%.
The worst annual price return occurred in 2022 at -85.78%.
These extremes are far removed from the full-dataset Direxion Daily Semiconductor Bull 3X Shares average return of +66.68%.
Direxion Daily Semiconductor Bull 3X Shares Price Return vs. Total Return
Understanding the type of return used on this page is essential.
The historical figures presented here are Direxion Daily Semiconductor Bull 3X Shares price returns.
Price return measures the change in the market price of the asset between periods.
The figures on this page do not include dividends.
Therefore, these results should not be interpreted as Direxion Daily Semiconductor Bull 3X Shares total returns.
A total-return series would incorporate dividends or other distributions according to the methodology of that series.
The chart, historical table, filters, and statistics on this page represent Direxion Daily Semiconductor Bull 3X Shares price performance only.
Direxion Daily Semiconductor Bull 3X Shares Return 2026 YTD
The current dataset shows the Direxion Daily Semiconductor Bull 3X Shares return for 2026 at +289.51% YTD.
Unlike the completed historical calendar-year observations, 2026 is still in progress.
TradingNInvestment therefore displays the 2026 YTD return separately.
It is excluded from calculations such as the historical average, median, best completed year, and worst completed year.
This prevents a partial-year observation from being treated as though it were directly comparable with a completed calendar year.
The 2026 YTD result can change when the underlying verified market data is updated.
Why the Median Direxion Daily Semiconductor Bull 3X Shares Annual Return Matters
Average return is one of the most commonly quoted historical stock market statistics.
But the median provides useful additional information.
Across the 15 completed years, the median annual Direxion Daily Semiconductor Bull 3X Shares price return was +69.74%, compared with an average of +66.68%.
The difference indicates that the distribution of historical annual returns is not perfectly symmetrical.
Large negative years can pull the arithmetic average downward.
Average, median, positive-year frequency, negative-year frequency, best year, and worst year together provide a more complete view of historical Direxion Daily Semiconductor Bull 3X Shares returns.
No single statistic captures the entire history.
How Often Have Direxion Daily Semiconductor Bull 3X Shares Returns Been Positive?
The dataset contains 10 non-negative years out of 15 completed years.
That corresponds to 66.67% of completed calendar years.
This is a historical frequency, not a probability forecast.
It would be incorrect to say that Direxion Daily Semiconductor Bull 3X Shares has a 66.67% probability of rising next year simply because 66.67% of these historical observations were non-negative.
Future market conditions can differ substantially from historical conditions.
The statistic describes what occurred across the observed period, not what must happen in the future.
Why Study Historical Direxion Daily Semiconductor Bull 3X Shares Returns?
Historical Direxion Daily Semiconductor Bull 3X Shares returns provide context that recent performance alone cannot provide.
A large gain or decline can appear unusual when viewed only against the most recent observations.
Comparing the current period with the available historical distribution helps show how it relates to earlier outcomes.
Historical returns can help investors, researchers, students, and analysts examine how annual performance has varied through the available record.
They can also reduce the tendency to use only recent performance as the reference point for evaluating the current year.
How to Use the Direxion Daily Semiconductor Bull 3X Shares Return Explorer
The TradingNInvestment Return Explorer is designed to make historicalDirexion Daily Semiconductor Bull 3X Shares returns easier to investigate.
Instead of presenting only a static chart, the tool allows readers to filter the same verified annual-return dataset.
Readers can examine all available years, non-negative years, negative years, and available historical periods.
The chart, annual-returns table, and summary statistics update from the same selected data.
Readers interested in downside history can examine the 5 negative calendar years in the completed-year dataset.
Readers studying non-negative historical performance can examine the 10 non-negative calendar years in the completed-year dataset.
When sufficient history is available, readers can also use the available period views to focus on more recent performance.
The purpose is not to predict the next Direxion Daily Semiconductor Bull 3X Shares return, but to make the available historical observations easier to explore and understand.
Reading Direxion Daily Semiconductor Bull 3X Shares Performance History in Context
One of the biggest risks when studying historical returns is selecting a period that confirms an existing belief.
A short period can appear exceptionally strong or exceptionally weak depending on its starting and ending years.
Using the broader available Direxion Daily Semiconductor Bull 3X Shares history provides additional context for interpreting shorter periods.
Different historical windows can produce different average returns, frequencies of positive and negative years, and extreme outcomes.
None of those periods is inherently the single correct measure of historical performance. They answer different questions about different parts of the available record.
This is why TradingNInvestment provides both the available historical series and interactive period filters.
What the Available Direxion Daily Semiconductor Bull 3X Shares Return History Shows
The dataset contains 15 completed calendar years of Direxion Daily Semiconductor Bull 3X Shares price-return observations.
Of those completed years, 10 were non-negative and 5 were negative.
When completed years were non-negative, the average annual return was +120.73%.
When completed years were negative, the average annual return was -41.41%.
The strongest completed calendar year in the dataset was 2019 at +229.84%, while the weakest was 2022 at -85.78%.
The overall average annual Direxion Daily Semiconductor Bull 3X Shares price return across the 15 completed calendar years was +66.68%.
Together, these statistics provide a broader view of the historical return distribution than the average alone.
The complete Direxion Daily Semiconductor Bull 3X Shares annual-return dataset allows readers to examine the individual yearly observations behind the summary statistics.
TradingNInvestment aims to make market history simple to read, easy to understand, and rigorous enough to support serious market research.
Research Context
Direxion Daily Semiconductor Bull 3X Shares Historical Returns Research
This TNI research page examines Direxion Daily Semiconductor Bull 3X Shares annual price returns by calendar year. The published dataset covers 2011–2025and separates completed historical years from current-year performance.
Annual price return is calculated from the final available closing price of each calendar year relative to the final available closing price of the prior calendar year. The page provides the year-by-year dataset, historical statistics, interactive visualization, and research methodology.
Risk & Due Diligence
Risk & Due Diligence
SOXL should be evaluated as a leveraged instrument with a daily investment objective. Returns over holding periods longer than one day can differ substantially from the fund's stated daily leverage multiple applied to SMH.
Daily compounding, volatility, derivatives, financing costs and fund expenses can materially affect longer-period results and the potential for loss.
Key due-diligence questions include:
- Daily objective: Is the investor evaluating SOXL based on the daily exposure it is designed to provide?
- Compounding: How did the sequence of daily SMH returns affect the cumulative SOXL result?
- Volatility: How did periods of high volatility affect the difference between SOXL and its underlying benchmark?
- Drawdown: How large were historical declines from previous peaks, and how long did recovery take?
- Holding period: How did SOXL perform over individual days, weeks, months, and longer periods?
- Benchmark comparison: How did the leveraged ETF compare with SMH over the same synchronized periods?
- Costs and implementation: How might fund expenses, financing associated with derivatives, trading costs, and the difference between market price and NAV affect an investor's realized result?
Important: Historical returns and drawdowns are observations from the available dataset. They are not forecasts or guarantees of future performance. For broader historical context across major market cycles, explore TNI's stock market historical returns.
Investors should review the fund's current prospectus, financial statements, and other official fund documents before making an investment decision.
TNI uses Yahoo Finance historical price and adjusted-close data for the independent return calculations and visualizations on this page. Official issuer information, fund objectives, portfolio composition and fund documents are presented separately in the fund-facts section below.
OFFICIAL FUND FACTS
Direxion Daily Semiconductor Bull 3X Shares (SOXL)
Seeks 300% of the daily performance of the NYSE Semiconductor Index, before fees and expenses.
Because the investment objective is daily, the fund's return over periods longer than one trading day should not be assumed to equal its stated leverage multiple applied to the longer-period return of NYSE Semiconductor Index.
IssuerDirexion
Daily Exposure3× long
UnderlyingICESEMIT
Inception2010-03-11
SOXL Holdings & Portfolio Structure
SOXL is a leveraged semiconductor ETF designed to provide 3× daily exposure to the NYSE Semiconductor Index. Because the leverage objective resets daily, longer-period returns can differ substantially from three times the index return.
- SOXL targets 300% of the daily performance of the NYSE Semiconductor Index, before fees and expenses.
- SOXL uses derivatives and other financial instruments to obtain leveraged semiconductor exposure.
- Daily leverage resets mean multi-day performance depends on both the path and volatility of semiconductor returns.
- SMH is used in TNI research as an investable semiconductor ETF comparison; it is not SOXL's official benchmark.
- Current holdings and portfolio exposures should be evaluated using the latest Direxion fund holdings and official fund documents.
Official fund information: Direxion — SOXL. TNI uses Yahoo Finance historical price and adjusted-close data for independent return, growth and drawdown calculations.
SOXL STOCK LEVERAGED ETF INTELLIGENCE
SOXL Returns FAQ
Frequently asked questions about historical returns, total return, leverage, compounding, benchmark performance and drawdown risk.
What is the SOXL ETF?
SOXL is Direxion Daily Semiconductor Bull 3X Shares, a leveraged ETF from Direxion. Seeks 300% of the daily performance of the NYSE Semiconductor Index, before fees and expenses. Its objective applies to a single trading day, so returns over longer periods can differ materially from the stated daily leverage multiple.
Is SOXL a safe investment?
SOXL is a leveraged ETF and can experience substantially larger gains and losses than SMH. Whether it is appropriate depends on an investor's objectives, holding period and ability to tolerate large drawdowns. The fund's daily reset, leverage, compounding and volatility can make longer-period results materially different from the underlying asset.
What is the difference between SMH and SOXL?
SMH is the underlying exposure used for comparison on this page, while SOXL is a leveraged ETF seeking 3× long daily exposure linked to SMH. SOXL resets its leverage daily, so owning SOXL is not economically identical to simply owning SMH at a fixed multiple for a long period.
What does SOXL invest in?
SOXL is a leveraged semiconductor ETF designed to provide 3× daily exposure to the NYSE Semiconductor Index. Because the leverage objective resets daily, longer-period returns can differ substantially from three times the index return.
The exact instruments, counterparties, collateral and portfolio weights can change over time, so current composition should be checked against the latest official Direxion fund information.
What are SOXL's holdings?
SOXL targets 300% of the daily performance of the NYSE Semiconductor Index, before fees and expenses. SOXL uses derivatives and other financial instruments to obtain leveraged semiconductor exposure. Daily leverage resets mean multi-day performance depends on both the path and volatility of semiconductor returns.
SMH is used in TNI research as an investable semiconductor ETF comparison; it is not SOXL's official benchmark. Current holdings and portfolio exposures should be evaluated using the latest Direxion fund holdings and official fund documents.
Does SOXL ETF pay dividends?
Distribution payments can vary over time. For performance analysis, TNI separates price return from total return: the total-return analysis uses adjusted-close history to incorporate distributions and their reinvestment effect, while the annual price-return series uses historical closing prices.
What is SOXL's historical average annual return?
Across 15 completed calendar years in this dataset, SOXL's average annual soxl price return was +66.68%. The current partial year is excluded from this historical average.
What is SOXL's 5-year return?
Over the latest five completed calendar years (2021–2025), SOXL produced a cumulative price return of +35.15%, equivalent to an annualized return of +6.21%.
What is SOXL's 10-year return?
Over the latest ten completed calendar years (2016–2025), SOXL produced a cumulative price return of +2255.06%, equivalent to an annualized return of +37.15%.
What were SOXL's best and worst years?
SOXL's strongest completed calendar year in this dataset was 2019, with a price return of +229.84%. Its weakest was 2022, with a price return of -85.78%.
How does SOXL compare with SMH?
TNI compares SOXL with SMH using synchronized historical periods, including year-by-year annual returns, rolling 10-year annualized returns, period returns and daily adjusted-close drawdowns.
Why doesn't SOXL return exactly 3× long of SMH over longer periods?
SOXL targets leveraged performance on a daily basis rather than promising a fixed multiple over longer holding periods. Daily resetting and compounding mean that the sequence of returns, volatility, fees and financing effects can cause longer-period performance to differ substantially from simply multiplying SMH's longer-period return.
What happens to SOXL when SMH falls?
SOXL seeks 3× long daily exposure linked to SMH. A decline in SMH can therefore produce a magnified daily decline in SOXL, before considering fees, expenses, tracking differences and market effects.
What is volatility drag in a daily leveraged ETF?
Volatility drag describes a compounding effect that can occur when returns fluctuate from day to day. Because percentage losses and gains compound from different portfolio values, repeated market swings can reduce longer-period compounded performance even when the underlying later returns near an earlier level.
How severe have SOXL's historical drawdowns been?
The drawdown analysis measures SOXL and SMH from synchronized daily adjusted-close data. It reports each series' maximum decline from a running peak, peak and trough dates, recovery timing, and the gain required to recover from the deepest observed loss in the available dataset.
Methodology & Source
How the annual returns are calculated
Annual price return is calculated using the final available close of each calendar year relative to the final available close of the prior calendar year. The current calendar year is shown as YTD and is excluded from completed-year summary statistics.
Data Source: Yahoo Finance — Direxion Daily Semiconductor Bull 3X Shares (SOXL). Return Type: SOXL Price Return.
Historical Returns Tell You What Happened Before. See What Is Happening Now.
Historical Direxion Daily Semiconductor Bull 3X Shares returns provide context for long-term market performance, strong years, drawdowns, and changing market conditions. TNI Intelligence tracks current market-moving news and live market intelligence as conditions change.
VIEW TODAY'S MARKET INTELLIGENCE