Market History & Risk: Market History
Market cycles and the events that shaped them.
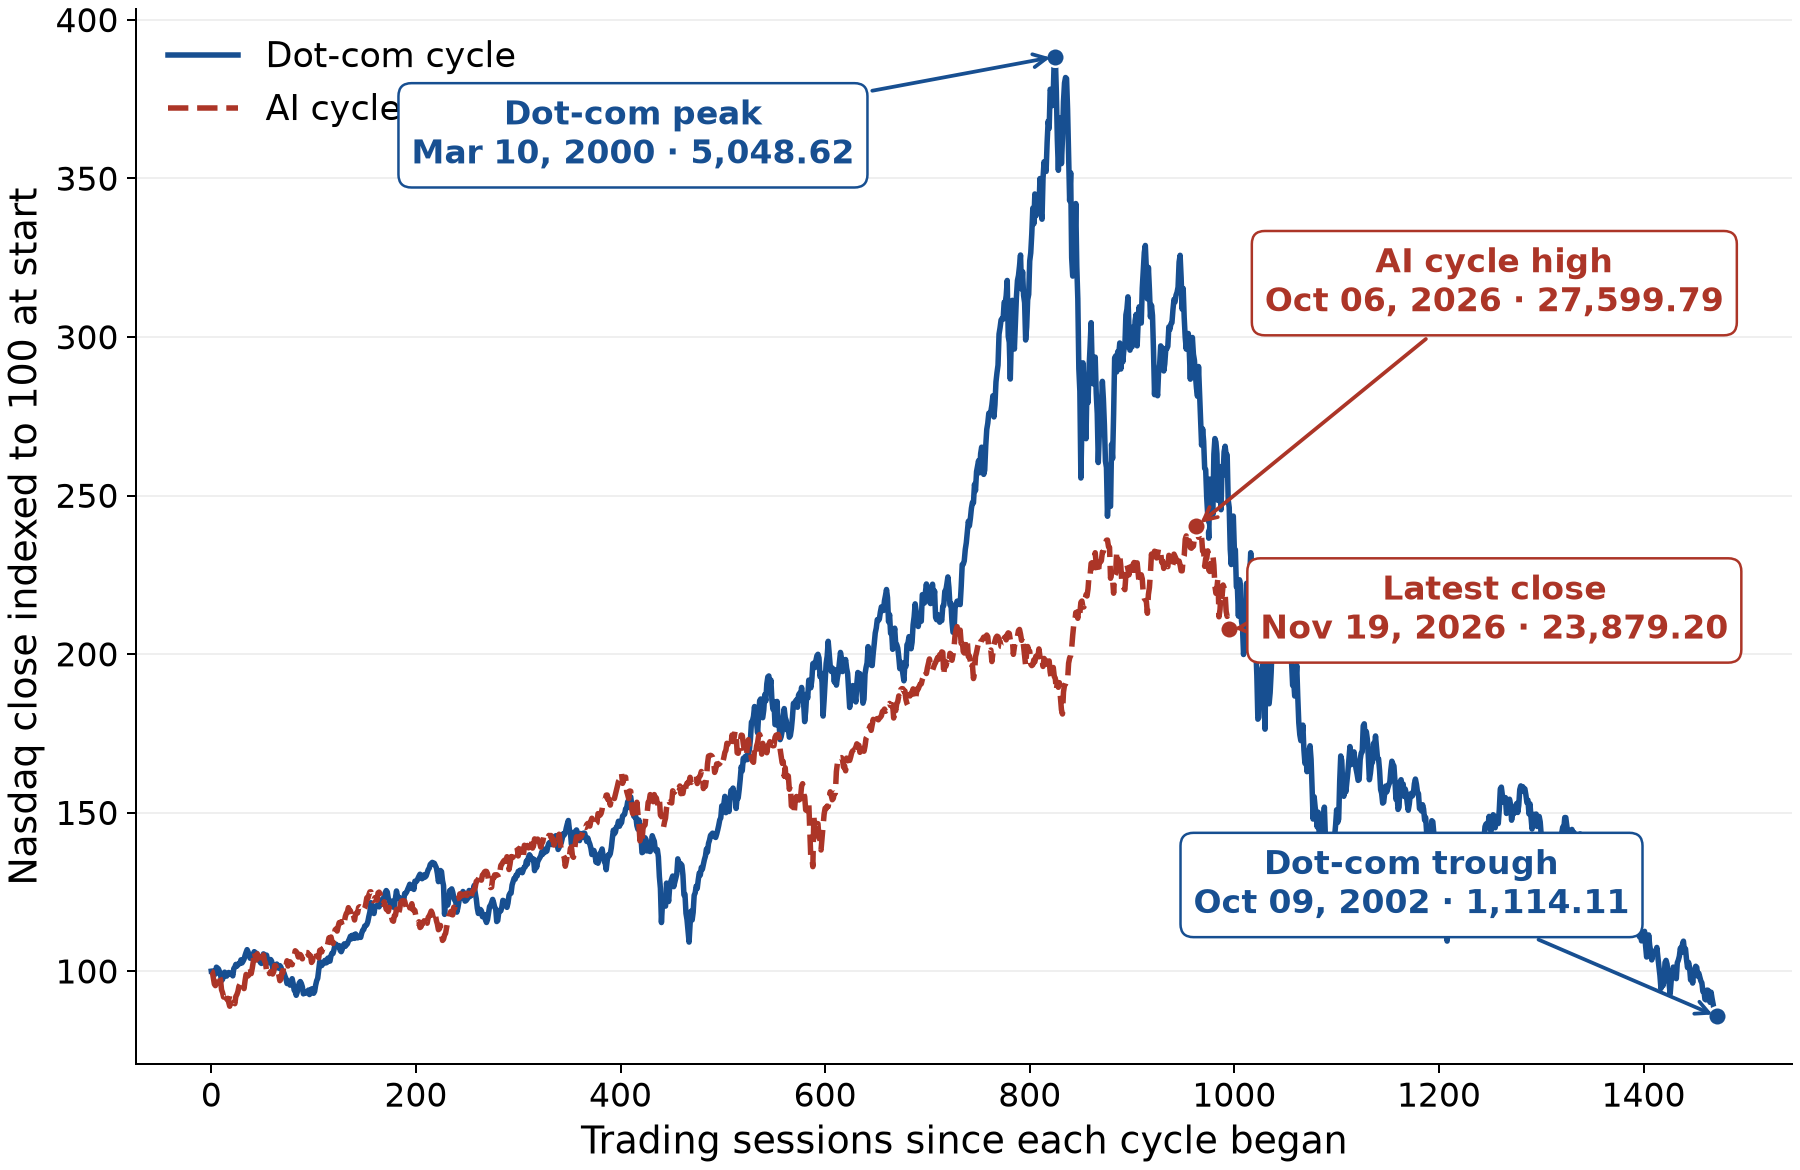
The Nasdaq Fell 13.48%. How Does Today’s AI Sell-Off Compare With the Dot-Com Crash?
The Nasdaq fell 13.48% from its October high. Compare 10 AI and semiconductor stocks with 10 dot-com leaders and track both Nasdaq cycles on one chart.
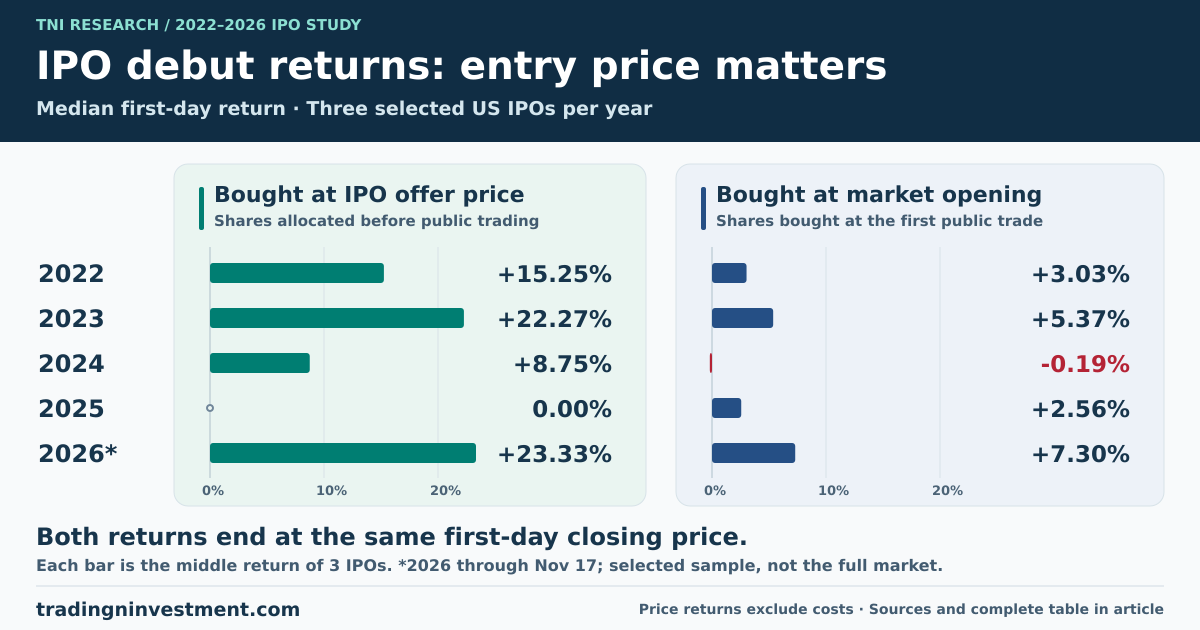
Anthropic IPO: Who Gets the First-Day Gains?
Three of 15 IPOs gained from their offer price but fell from their opening trade. Compare debut returns, entry prices and Anthropic’s financial risks.
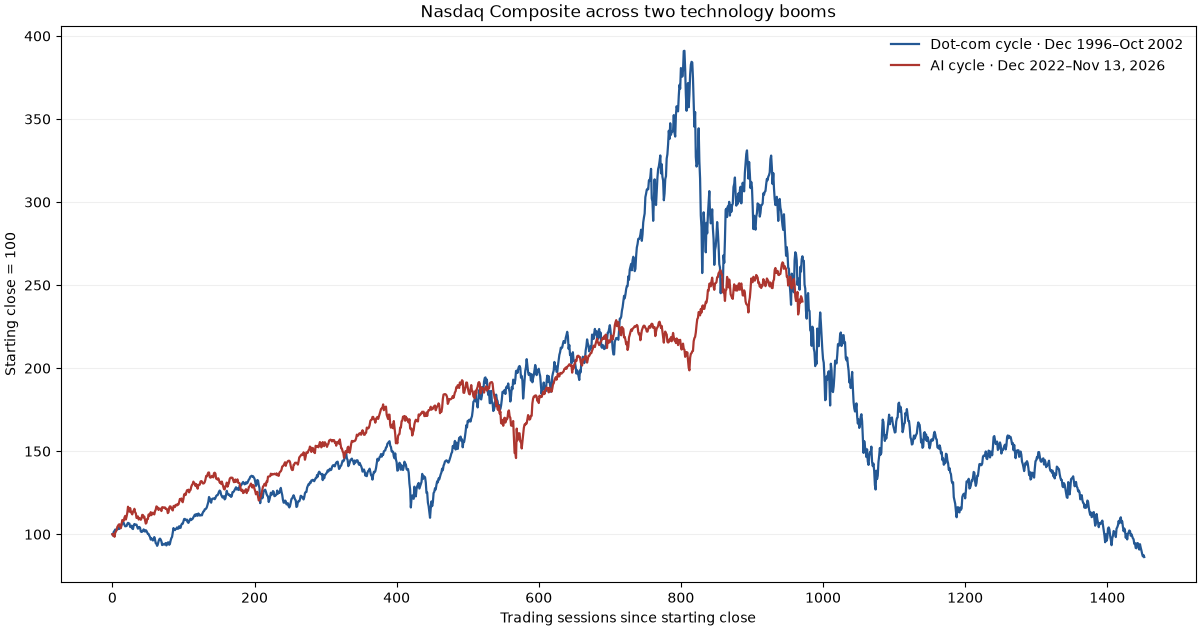
Nasdaq AI Stock Crash 2026 vs. the 2000 Dot-Com Bubble
Original research comparing the Nasdaq AI selloff with the dot-com crash, major technology-stock drawdowns and historical forward returns after severe market declines.
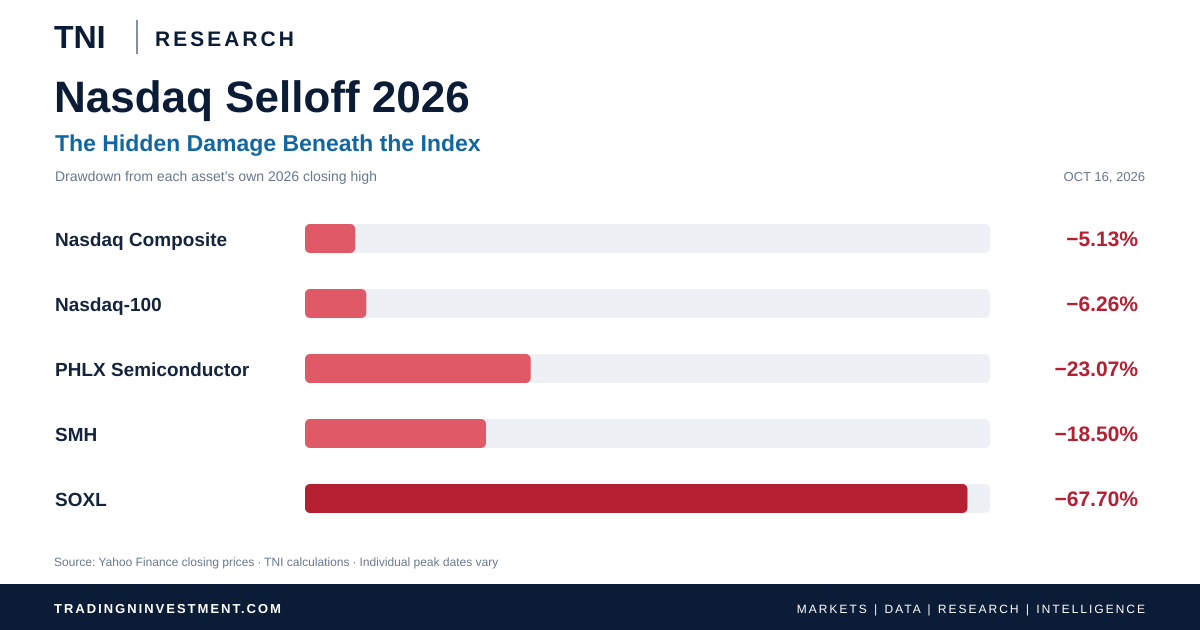
Nasdaq Selloff 2026: AI Stocks, Semiconductor Risk and SOXL
Original TNI research on the 2026 Nasdaq selloff, semiconductor stock drawdowns, SOXL daily leverage risk and historical market corrections.

100 Years of Dow Jones Industrial Average: Events, History & Charts (1920–2026)
Explore Dow Jones history from 1920 to 2026, including major market events, historical charts, crashes, and recoveries.
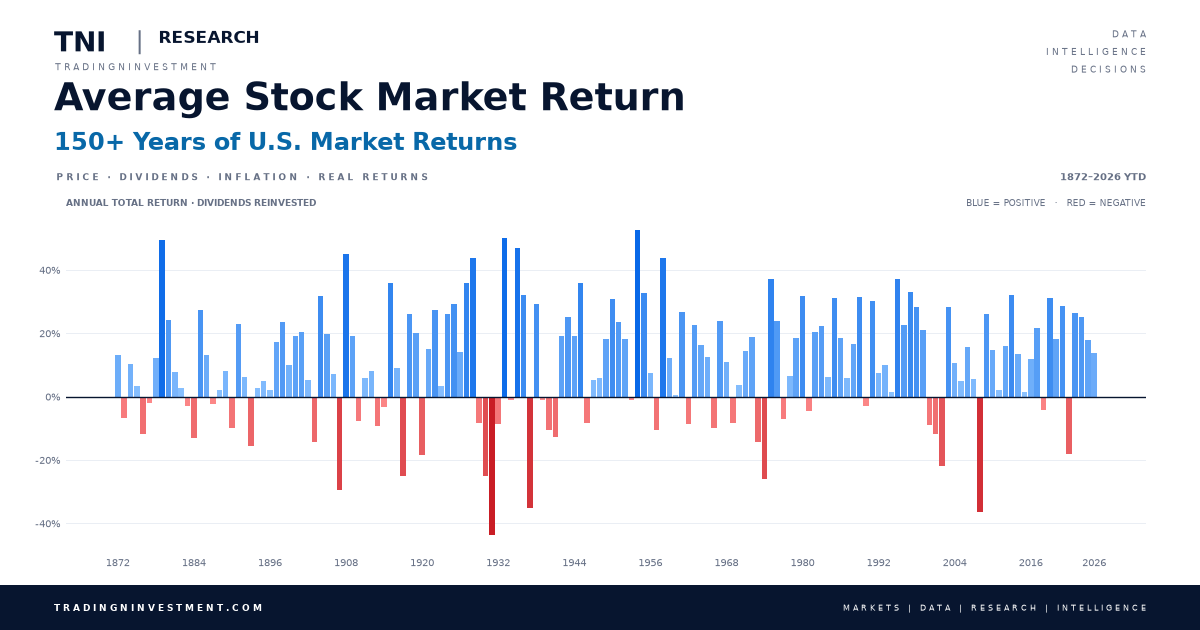
Average Stock Market Return: The Power of Reinvested Dividends
$10,000 grew to $8.12 billion in a 1872–2025 historical model. Dividends and reinvestment explain 99.8% of ending wealth versus price-only growth. Explore the data.
Stock Market Crash of 1929
The Roaring Twenties, the Dow Jones peak, the 1929 crash timeline, and the prolonged decline that followed.