The Research Library
Search every published study by company, ticker, title, or topic.
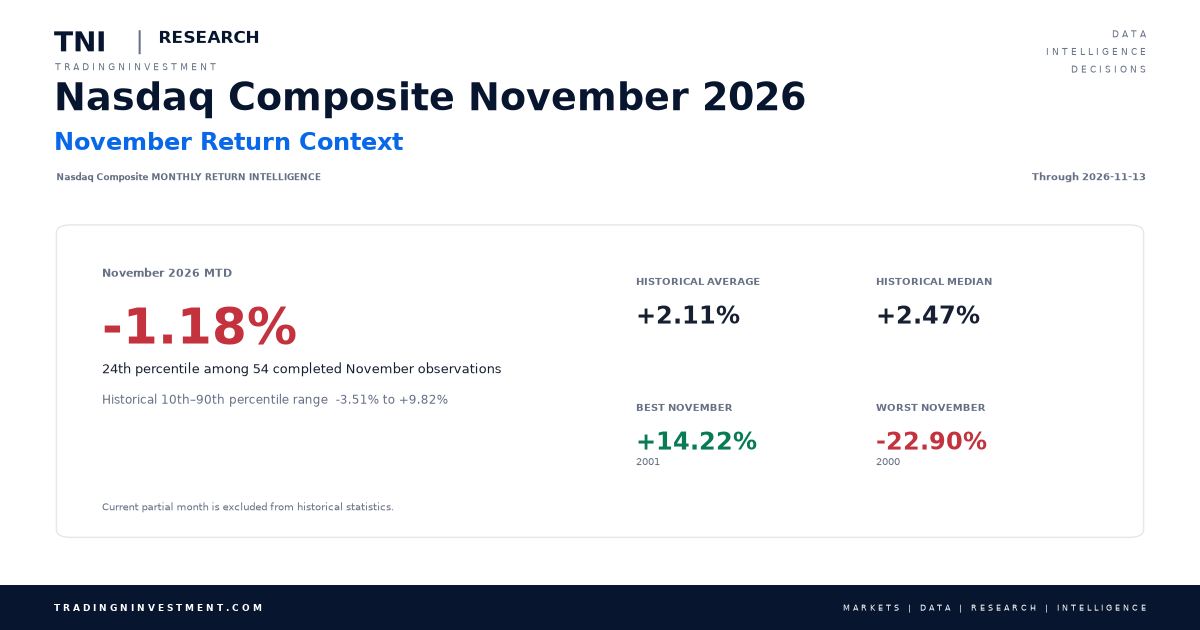
Nasdaq Composite Monthly Returns: Historical Returns by Month
Explore Nasdaq Composite monthly returns from 1972 to the present, including historical returns by month, positive and negative month frequency, average returns, seasonal patterns, and current month performance.
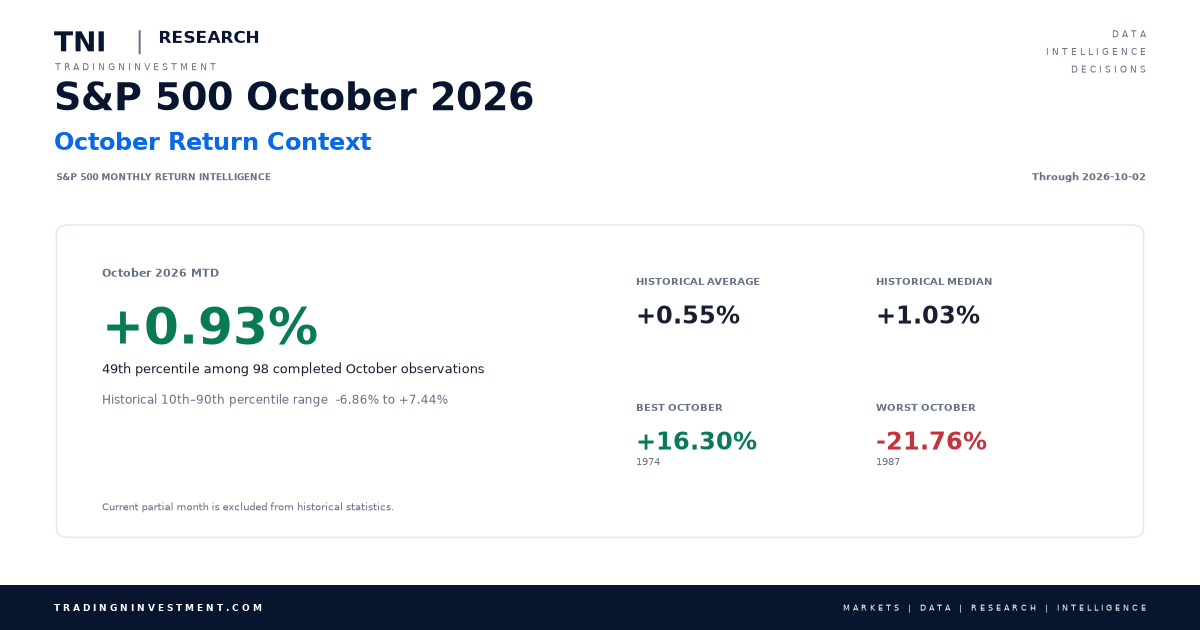
S&P 500 Monthly Returns: Historical Returns by Month
Explore S&P 500 monthly returns from 1928 to the present, including average returns by month, positive and negative frequency, seasonal patterns, historical monthly performance, and current month-to-date performance.
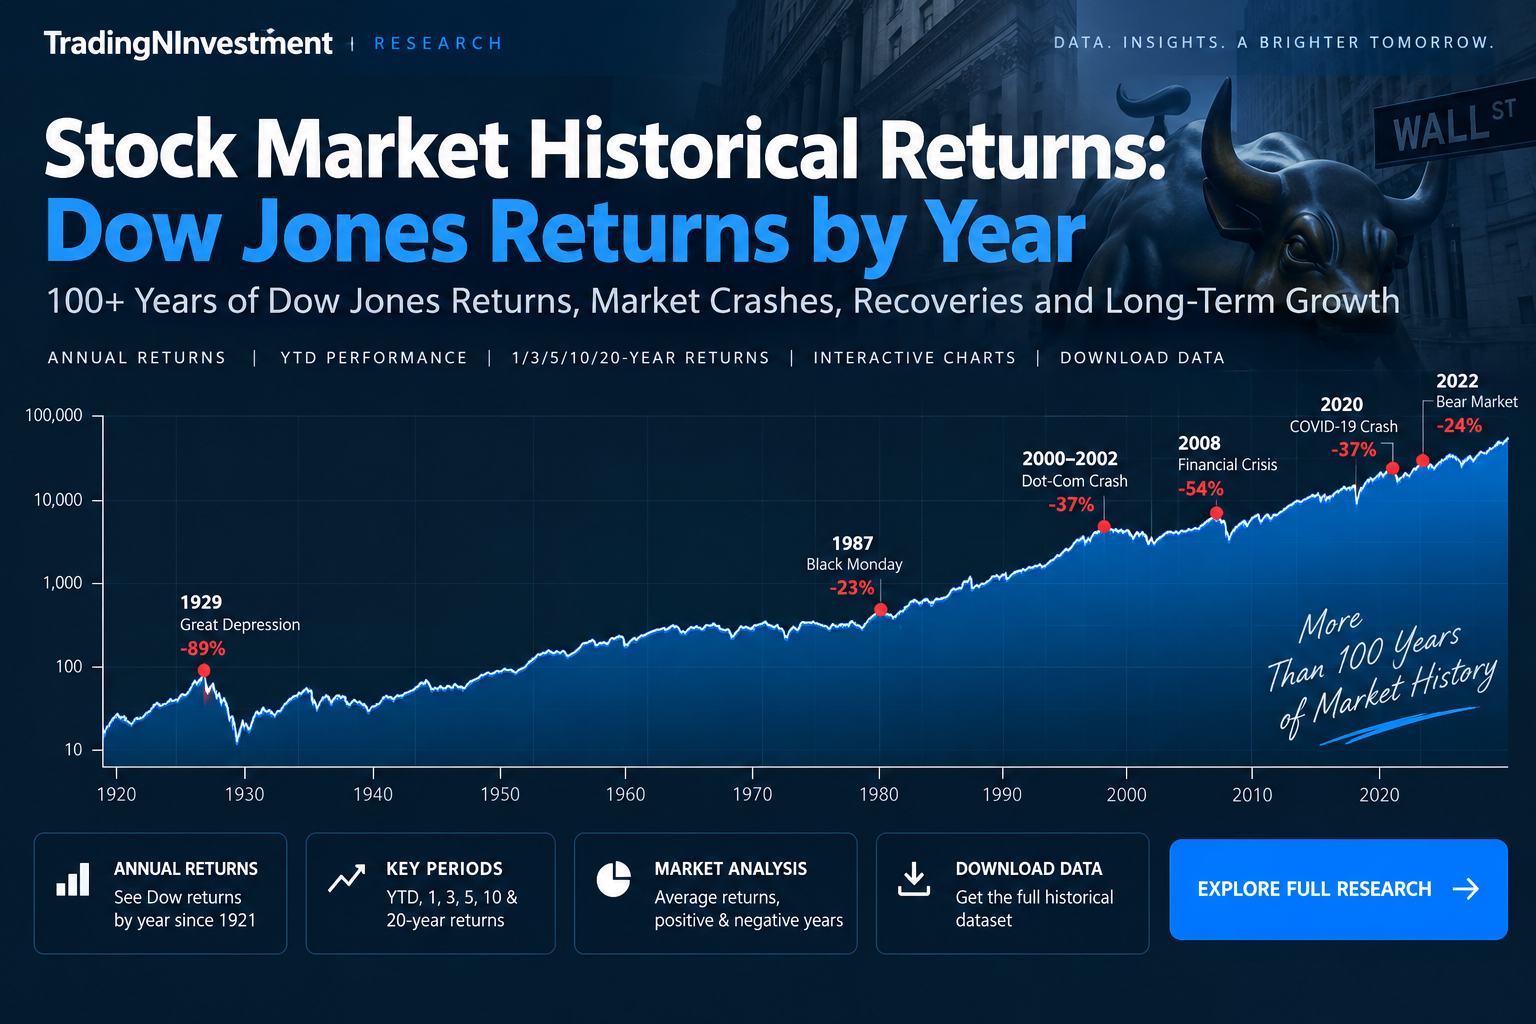
Stock Market Historical Returns: Dow Jones Returns by Year (1921–2026)
Dow Jones historical returns by year from 1921 to present, including 1-year, 3-year, 5-year, 10-year and 20-year performance, average returns, positive and negative years, and 2026 YTD performance.
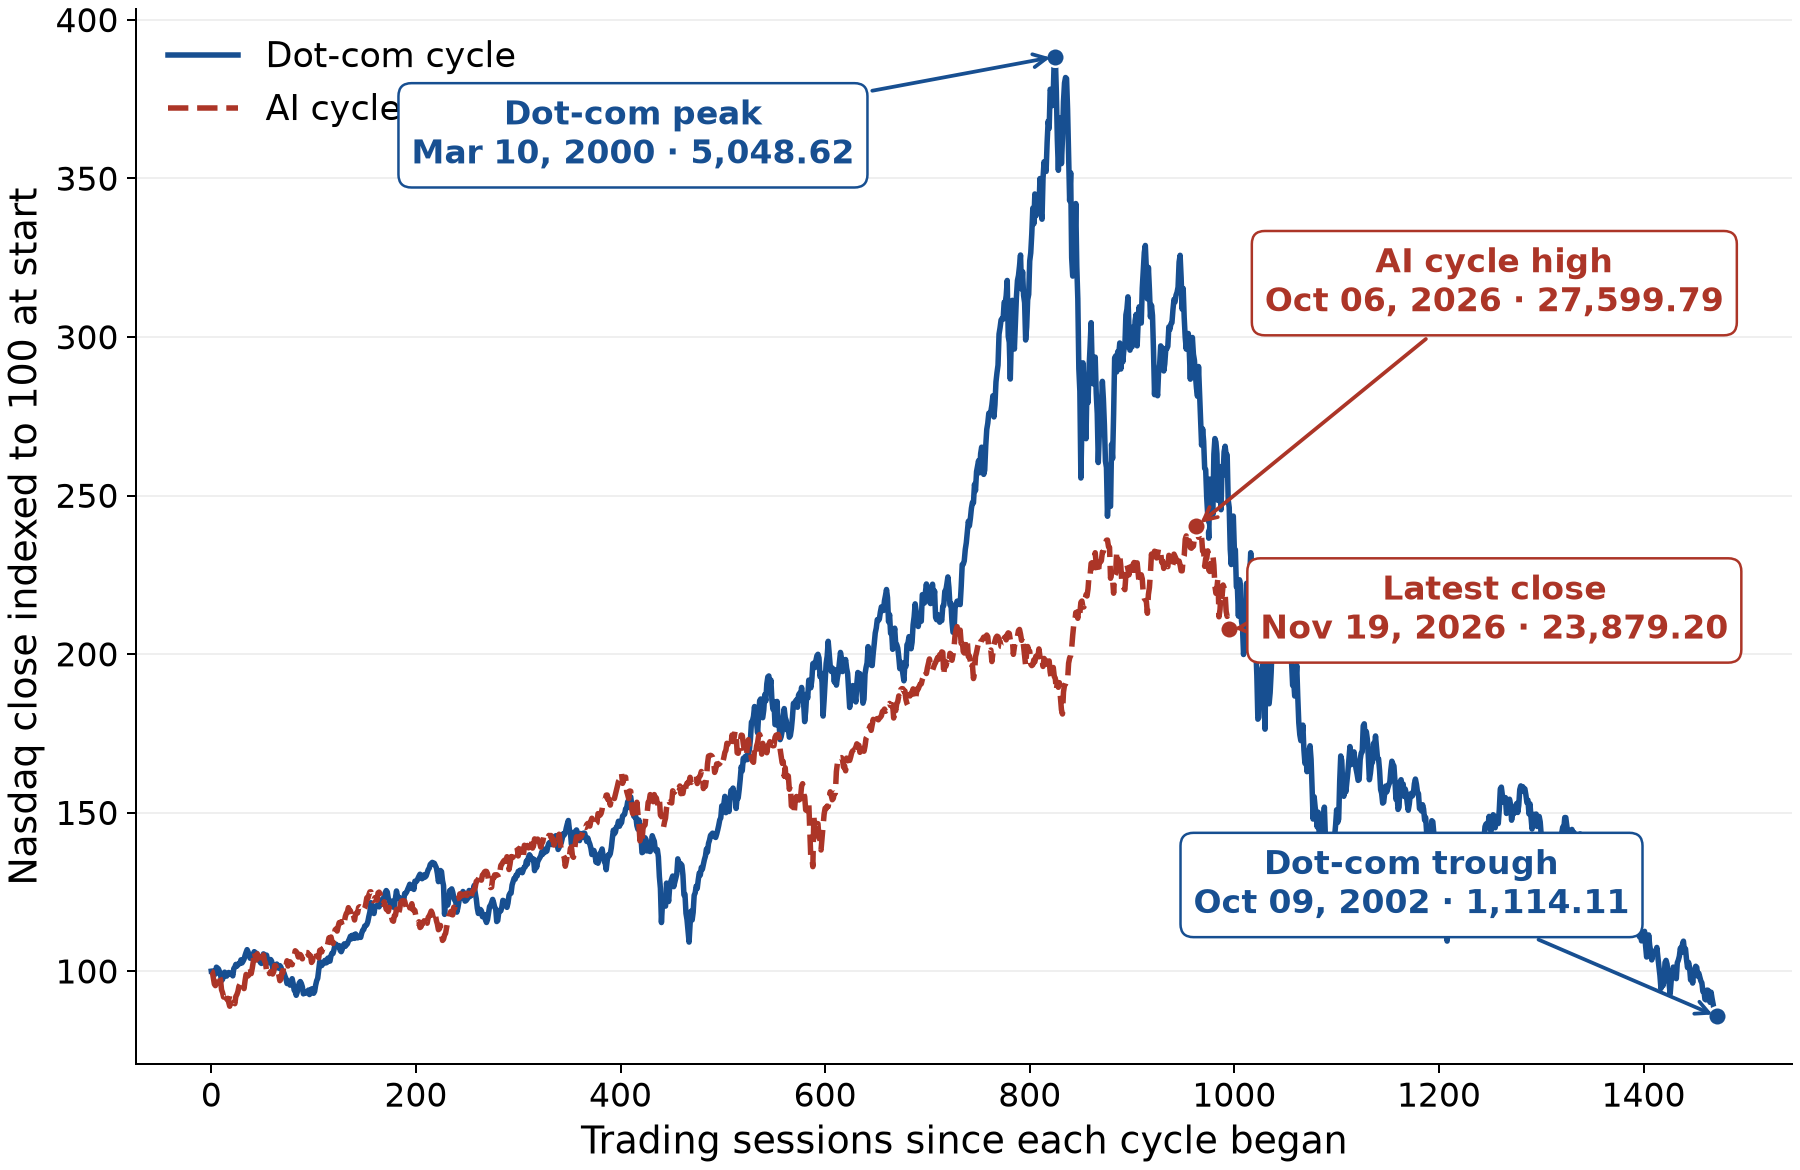
The Nasdaq Fell 13.48%. How Does Today’s AI Sell-Off Compare With the Dot-Com Crash?
The Nasdaq fell 13.48% from its October high. Compare 10 AI and semiconductor stocks with 10 dot-com leaders and track both Nasdaq cycles on one chart.
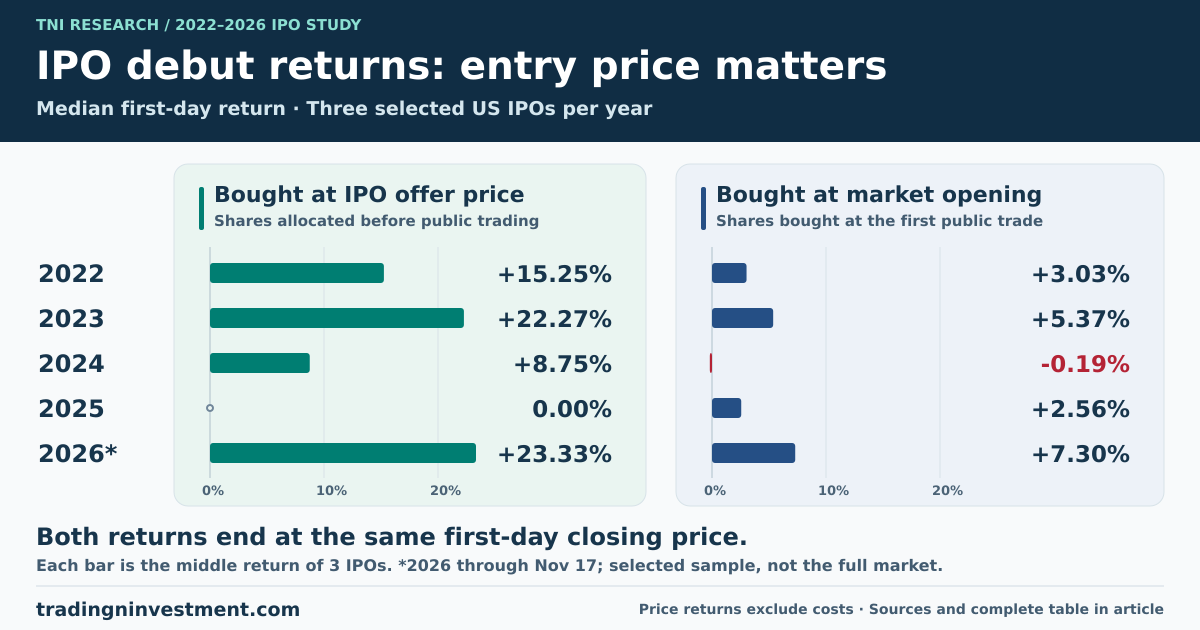
Anthropic IPO: Who Gets the First-Day Gains?
Three of 15 IPOs gained from their offer price but fell from their opening trade. Compare debut returns, entry prices and Anthropic’s financial risks.
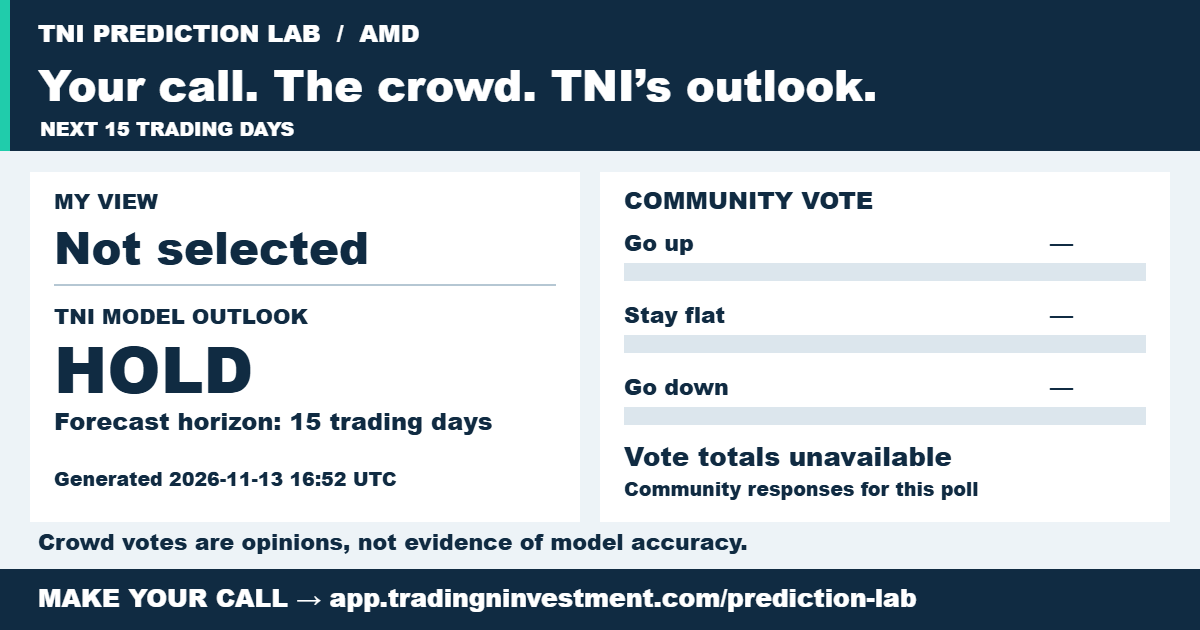
Are AMD and Nvidia a Buy, or Could Both Fall Again? TNI’s 15-Day Stock Forecast
TNI’s 15-day stock forecast rates AMD and Nvidia HOLD. See why Nvidia’s Quant Agent signaled BUY and what the price trends show for both stocks.
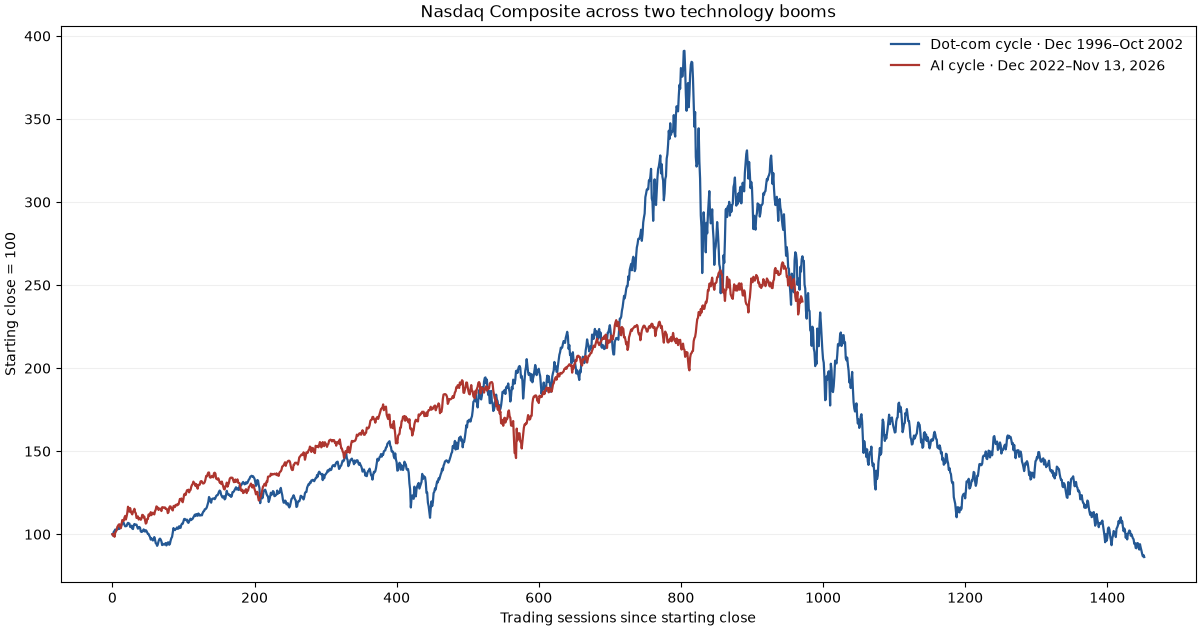
Nasdaq AI Stock Crash 2026 vs. the 2000 Dot-Com Bubble
Original research comparing the Nasdaq AI selloff with the dot-com crash, major technology-stock drawdowns and historical forward returns after severe market declines.
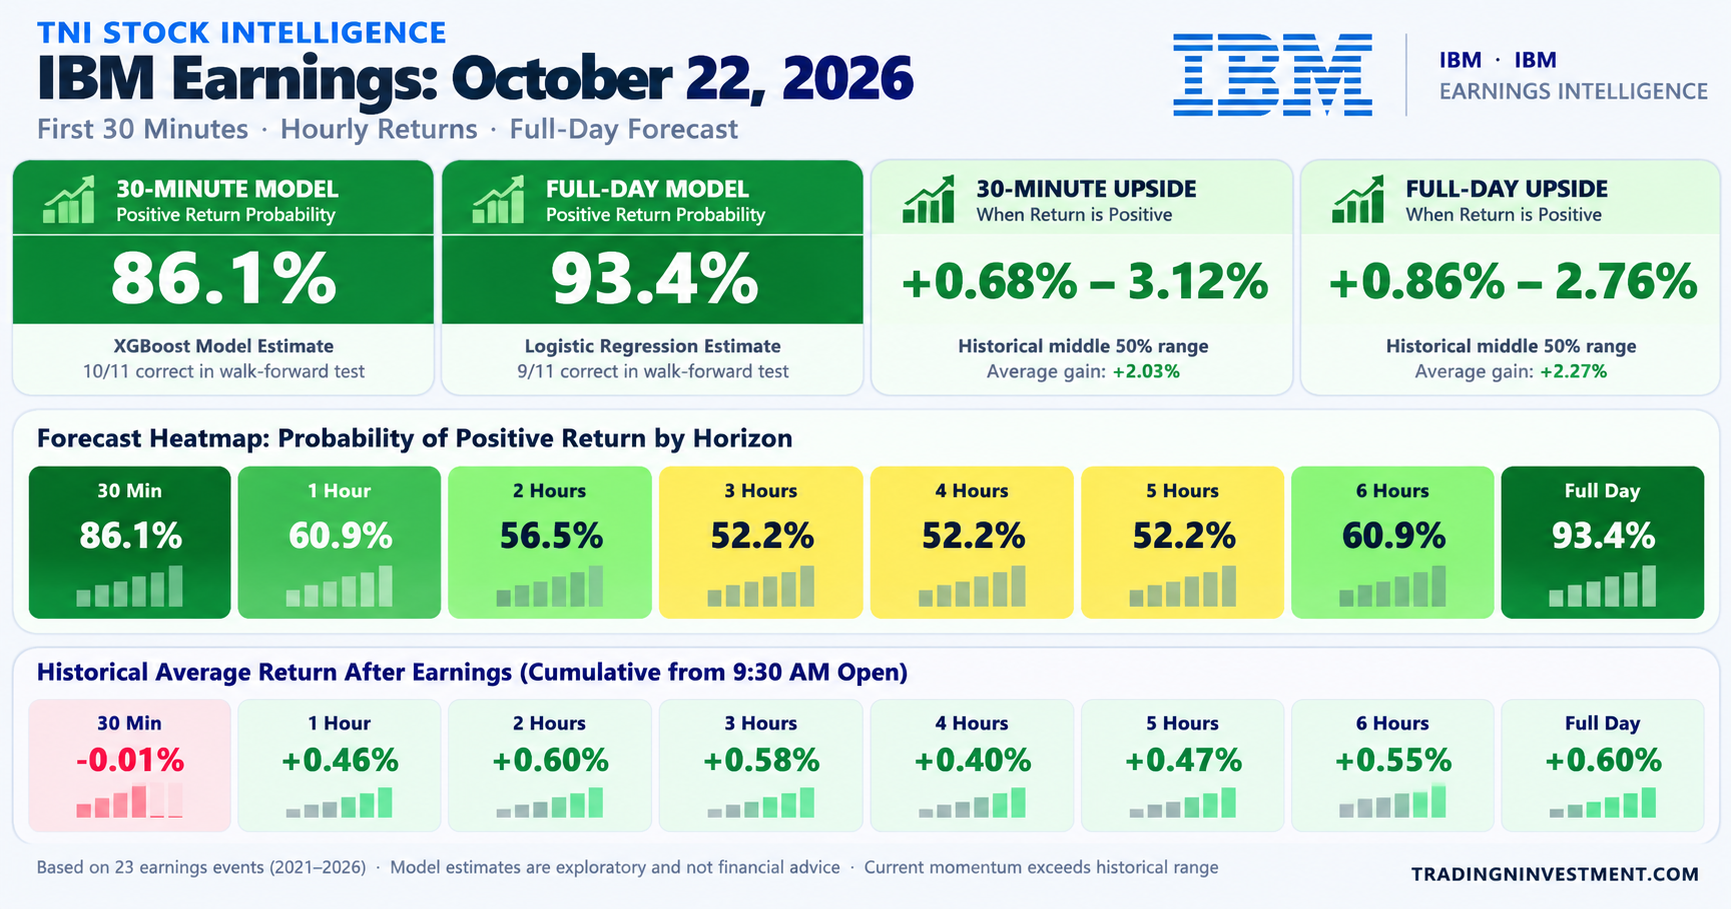
IBM Earnings Prediction: First 30 Minutes, Hourly Returns and Full-Day Outlook
Original IBM earnings research covering 23 historical events, intraday returns, walk-forward model validation and the October 22, 2026 outlook.
iPhone Launch & Stock Performance (2007–2026)
Interactive AAPL versus S&P 500 announcement returns, excess performance, and historical iPhone sales research.
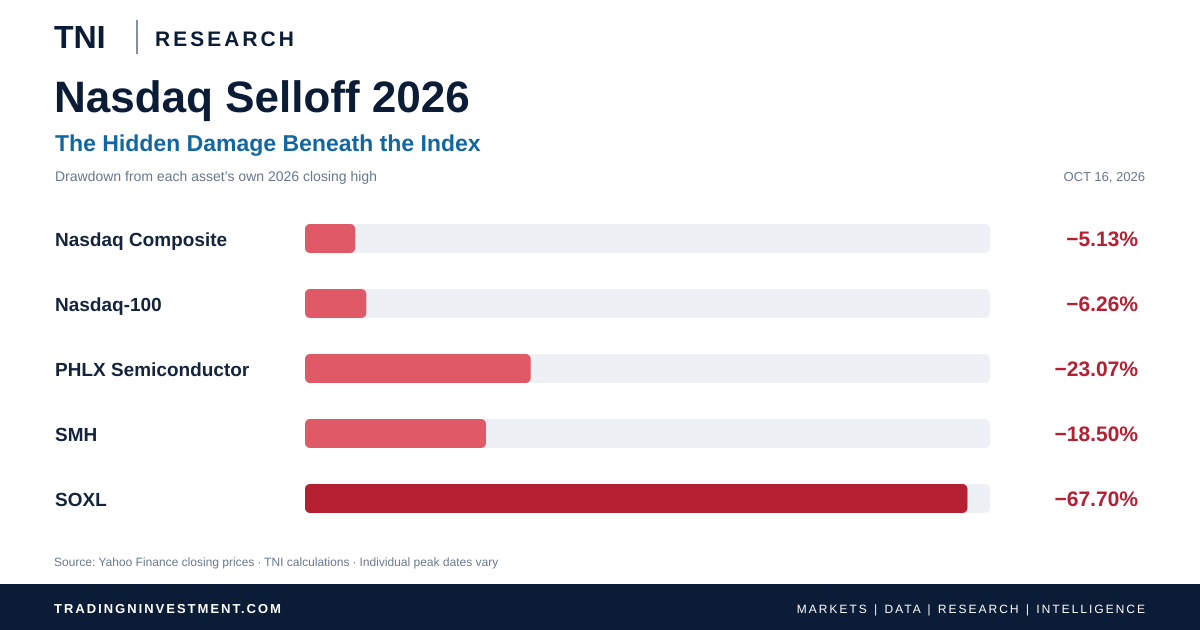
Nasdaq Selloff 2026: AI Stocks, Semiconductor Risk and SOXL
Original TNI research on the 2026 Nasdaq selloff, semiconductor stock drawdowns, SOXL daily leverage risk and historical market corrections.
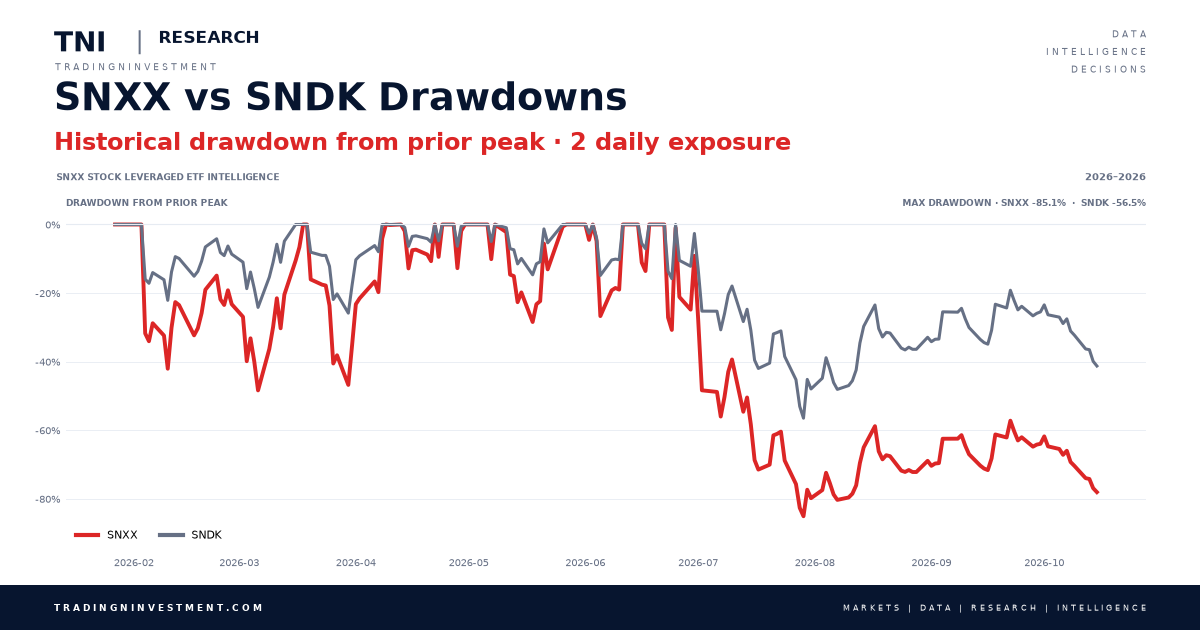
SNXX Leveraged ETF: Performance, Returns & Risk vs. SNDK
Original research comparing SNXX and SNDK through daily returns, monthly performance, growth of $10,000, drawdowns, and rolling volatility.

100 Years of Dow Jones Industrial Average: Events, History & Charts (1920–2026)
Explore Dow Jones history from 1920 to 2026, including major market events, historical charts, crashes, and recoveries.